Abstract
This essay explores the correlation between high alpha levels in individuals and their states of relaxedness and alertness. It also establishes the development of low alpha levels when the individuals are subjected to stressful conditions. The alpha brain waves are easily detectable when a person is in a state of relaxation, alertness, and/or intuition. In the context of this essay, it has been revealed that the frequency of the waves falls between 8 and 13hertz.The study focuses on examination of the effects of EEG alpha values on relaxation and alertness of an individual upon exposure to stressful conditions.
In the study, a sample of 23 participants was subjected to two tests. The first test involved a relaxed condition; while the other was conducted under a stressful setting. Since anxiety and stress are major components of emotion that influence the activity of an individual, the results indicated a strong presence of alpha waves in individuals who were in relaxed or alert states. However, there was an evidence of decreased alpha wave activity when a person was stressed. As a result, the findings were significant.
Introduction
The human brain is the processor of information about the activities that happen both inside and outside the body. Researchers attest that billions of nerves transmit information from various parts of the body to the brain through the nervous system in form of electrical and chemical signals. Depending on the nature of information that is interpreted in the brain, the body can remain in either a state of relaxation or stress. Electroencephalography is the measurement and recording of electrical impulses along the scalp. An electroencephalograph (EEG) monitors the variation in voltage fluctuation due to the activity of neurons in the brain.
This essay seeks to establish the correlation between EEG measurements and relaxed or stressed conditions. Transition to sleep was one of the earliest notable changes in the EEG spectrum that were associated with low frequency alpha waves (Davis, Davis, Loomis, Harvey, & Hobart, 1938; Frost, Burish, & Holmes, 1978). Alertness, relaxation, and stress are elements that are associated with brain activity. The EEG records the state of alertness as abnormal because it occurs in an inappropriate area of the scalp (Sucholeiki, 2014). Relaxation also affects the EEG spectrum. According to a study that was conducted by Teplan, Krakovská, and Spajdel (2014), the alpha values increased when a person was in a relaxed state.
The aforementioned studies represent various measurements of the relationship between EEG and an individual’s state of relaxation or stress. However, the results are only based on the peak rate of alpha, which is rarely showed by the EEG. Consequently, the studies cannot provide accurate results. The analysed values of alpha were determined under both stressed and normal conditions of the subjects (Pandiyan, Yaacob, & Saidatul, 2015). The study was guided by the following alternative hypothesis.
There is a correlation between alpha waves and relaxation
Method
The study was subdivided into two phases. The first part involved relaxation of the participants. The second part entailed introduction of the subjects to stress stimulus, which was accomplished through verbal communication. The investigator used EEG to measure the alpha wave rates for both conditions by noting the voltages at intervals of 3 minutes in a period of 12 minutes.
The 23 subjects were selected from a convenient population of psychology undergraduate students in four evenly distributed study groups. The sample comprised11 males and 12 females whose ages lied between 20 and 30 years. Awareness of the need for confidentiality and purpose of the research was created amongst the groups.
Apparatus
The experiment used three electrodes that were placed on either side of the forehead. ABIOPAC and EEG computer programs were installed to monitor and record the measurements of alpha waves in form of voltages. Two electrodes were attached to the foreheads of each participant. The third electrode was placed on the neck, next to the carotid artery. A quick calibration was done prior to each measurement. Testing of the relaxation condition required the participants to sit quietly whilst closing their eyes. Various stress-causing factors that were verbally communicated to the subjects included assessment deadlines, upcoming examinations, news, current affairs, and shortage of graduate jobs in their chosen careers among others. A computer that monitored the BIOPAC recorded the alpha values of each subject. Thereafter, the collected data was categorised into demographic, descriptive, and inferential analysis.
Results
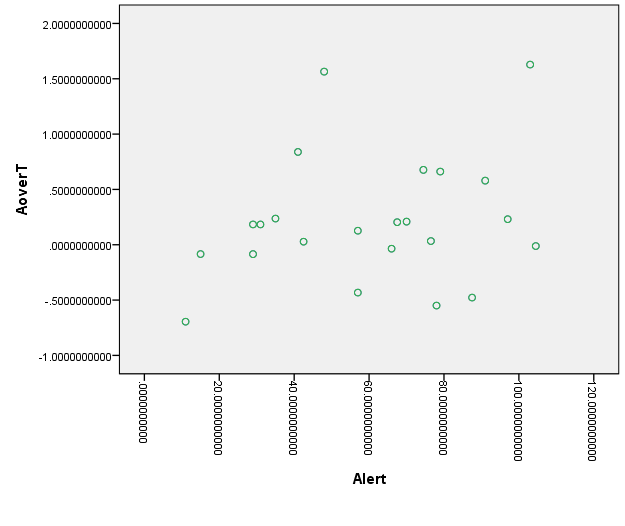
The alphatotheta values were correlated using the Pearson test. The mean and standard deviations of the two variables were obtained. The Pearson correlation between the alpha and relaxation was determined to be 0.244, while the two-tailed test recorded 0.266. The mean and standard deviation of both alpha values were 0.218087922565 and 0.5813702618191, while the alertness results were 60.434782608696 and 27.7276955193581 respectively.
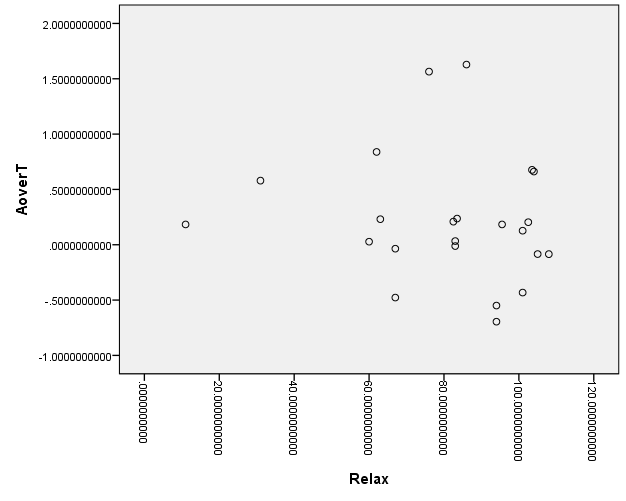
From the relaxation analysis, the Pearson correlation between alpha over theta (A over T) and relaxation was -0.138, while the two-tailed test recorded 0.529. The mean and standard deviation for alpha was 0.218087922565 and 0.5813702618191, while the relaxation test recorded 81.021739130435 and 24.4347360147531 respectively. The same procedure was conducted for both the alpha and relaxation values. In addition, the hypothesis under test was two-tailed for both cases. The information from the analysis is listed in the appendix.
Discussion
Data Analysis for Demographic Variables
The demographic variables included age and gender. They were analysed by univariate analysis (tables). The analysis was easily accomplished using the SPSS version 21. The purpose of the univariate analysis was to highlight information on age distribution frequencies, central tendencies, measures of dispersion, standard deviation, and variance (Sugiyono, 2008; Brace, Snelgar, & Kemp, 2012).
A five-point Likert scale that had scores marked as “1” representing “very relaxed” , “2”for relaxed, “3”for “not relaxed”, “4”for “stressed”, and “5”for “very stressed” was also used in the test to show the level of the condition (Sugiyono, 2008).The subjects were then introduced to stress stimulus in the second phase. At the same time, the Likert scale was used to mark their responses concerning their feelings.
The alpha wave indicated from the computer for relaxed and stress-induced stimuli were similar and stable. A similarity in their standard deviations was also recorded. However, the standard deviations differed significantly after a minute. The subjects under the stress stimuli recorded a significant reduction in alpha waves. After the stimuli were reduced, the waves gradually rose to the stability level. This situation was similar to the results that were obtained when the subjects were exposed to stress-free conditions
Irrespective of the two test conditions, a similar figures and alpha wave formation were recorded among different age groups that included men and women. The alpha results indicated a frequency that fell between 7 and 12 Hz under normal conditions, while those under the stress stimulus showed a significantly reduced frequency that went below 7Hz. The researcher also found out that there was a consistency in the results among the subjects under stress conditions (Coolican, 2009). Stress-triggering factors such as verbal communication about examination and lack of job opportunities among others were indicated as the main causes of the fall of alpha waves in the brain as recorded by the researcher. A higher decrease of alpha waves was because of decreased normal functionality of brain when a subject is introduced to stressful stimuli (Pandiyan et al., 2015). These findings were thus significant.
Data Analysis for Study Variables
The research was based on the following hypothesis. There is a correlation between alpha waves and relaxation. The independent variable analysed was alpha wave readings while the dependent variable analyzed was relaxation. In this case, inferential statistics were used to show other information that was important for other researchers (Sugiyono, 2008). A two-tailed t-test was also conducted. The EEG readings revealed that higher levels of slow alpha wave activities were dominant when the subjects were introduced to stress stimuli. Another reading of higher levels of rapid alpha wave activities as indicated by the investigator were when the subjects were at a relaxed state.
Based on the results, the researcher noted a positive correlation where the alpha values increase as individuals become more alert and relaxed. However, the values decrease when they are stressed. Other researchers have also attested that there is a significant correlation between the changes in brainwork and frequency of the alpha waves (Nomura et al., 2006; Teplan et al., 2014; Angelakis et al., 2007; Kilterman & Kamiya, 1970). The investigator concluded from the results that a higher correlation exists between the EEG activity and relaxation or reduced stress conditions. This result is also supported by a study that was conducted among various Dutch employees. It was aimed at investigating the effects of alpha waves on participants who were stressed. The result indicated that stressed subjects exhibited lower levels of alpha waves (Ossebaard, 2000).
Conclusion
The research was aimed at establishing the correlation between EEG record on alpha wave activity and relaxation. The results revealed that the alpha waves were highly detected in relaxed subjects when not introduced to stress stimuli such as stress or anxiety. The results that were obtained from various stress conditions indicated a reduced frequency of the alpha waves as recorded by the EEG. This situation indicated that stress was a factor that lowered the level of alpha waves; hence, it affected brain functionality.
Reference List
Angelakis, E., Stathopoulou, S., Frymiare, J., Green, D., Lubar, J., & Kounios, J. (2007). EEG neurofeedback: a brief overview and an example of peak alpha frequency training for cognitive enhancement in the elderly. The Clinical Neuropsychologist, 21(1), 110-129.
Brace, N., Snelgar, R., & Kemp, R. (2012). SPSS for Psychologists. New York, NY: Palgrave Macmillan.
Coolican, H. (2009). Research Methods and Statistics in Psychology. London: Routledge.
Davis, H., Davis, P., Loomis, A., Harvey, E., & Hobart, G. (1938). Human brain potentials during the onset of sleep. Journal of Neurophysiology,1(1), 24-38.
Frost, R., Burish, T., & Holmes, D. (1978). Stress and EEG-Alpha. The Society For Psychological Research, 15(5), 394-7.
Nomura, T., Higuchi, K., Yu, H., Sasaki, S., Kimura, S., Itoh, H.,…Kawai, K. (2006). Slow‐wave photic stimulation relieves patient discomfort during esophagogastroduodenoscopy. Journal of gastroenterology and hepatology,21(1), 54-58.
Ossebaard, H. (2000) Stress reduction by technology? An experimental study into the effects of brain-machines on burnout and state anxiety. Application of Psychophysiology Biofeedback, 25(2), 93-101.
Pandiyan, P., Yaacob, S., & Saidatul, A. (2015). The assessment of developed mental stress elicitation protocol based on heart rate and EEG signals. International Journal of Computer Theory and Engineering, 7(3), 207.
Sucholeiki, R. (2014). Normal EEG Waveforms. Web.
Sugiyono, J. (2008). Statistical for Research. Bandung, Indonesia: Alfabeta Press.
Teplan, M., Krakovska, A., & Spajdel, M. (2014). Spectral EEG features of a short psychophysiological relaxation. Measurement Science Review, 14(4), 237-42.
Appendix
First Analysis: The Relationship between Alpha Values and Relaxation