Introduction
Online stores are a significant element of the modern economy. These businesses account for an essential market share because they provide millions of customers with the ability to purchase products via the Internet. Currently, Amazon is one of the most successful representatives in this field internationally. For example, in the United States of America, the given company holds almost half of the online sales market (Kim & Su, 2019). There is no doubt that this scenario results in massive economic benefits for Amazon, but one should also emphasize that the company influences the US market in a particular way.
It is worth considering that numerous factors demonstrate how Amazon impacts the US economy. Firstly, the business is a leading promoter of innovation in the US because it has made “more than $270 billion in investments” since 2010. (Amazon, 2020, para. 2). This state of affairs has resulted in the fact that eco-friendly equipment, customer satisfaction, and others characterize the American online sales market. Secondly, Amazon has had a significant impact on the employment market. The company alone created more than two million jobs in the US. Furthermore, Amazon (2020) admits that those small and medium-sized businesses that use its services tend to witness improved hiring growth. Finally, it is impossible to underestimate Amazon’s role when it comes to American taxation. In 2019, Amazon (2020) “collected and remitted nearly $9 billion in sales and use taxes to states and localities throughout the US” (para. 6). This information means that the future of the American economy, to some extent, depends on Amazon and its success. Thus, it is necessary to analyze the company’s economic indicators to understand whether they have useful information regarding the business’s performance.
Graphical Representations of Data
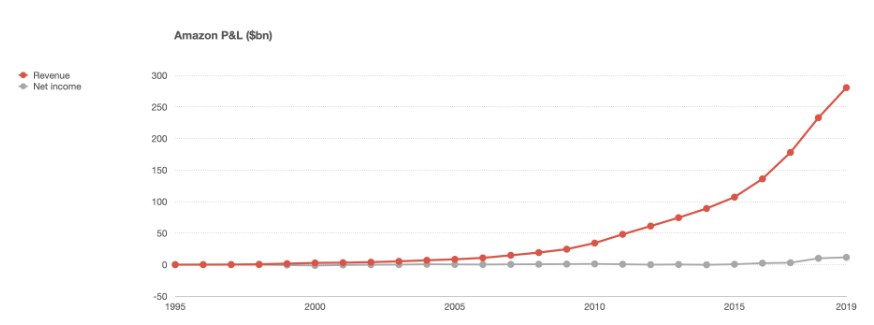
One can state that it is reasonable to start by considering Amazon’s profitability. Figure 1.1 by Evans (2020) demonstrates a significant difference between the company’s revenue and net income. This phenomenon can be explained by the fact that the business reinvests much of its money back in its growth. The graph above demonstrates that this scenario leads to some advantages because Amazon keeps increasing its revenue and income for more than two decades. The active reinvestment strategy is necessary to meet the growing demand. Evans (2020) explains that sales volumes keep rising, which leads to a continuously increasing Amazon’s market share in the US market. Thus, the graph’s shape allows supposing that the company under consideration will only strengthen its role in the American economy, providing the US with many economic benefits.
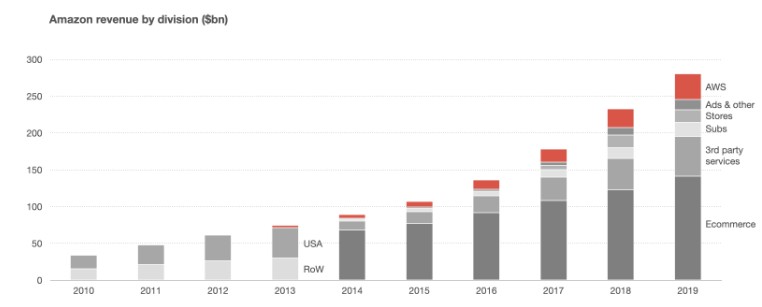
Based on the information above, it is reasonable to analyze why Amazon is famous among many customers. Thus, Figure 1.2 by Evans (2020) highlights the company’s leading sources of revenue. The graph indicates that e-commerce is the most successful market segment for the company. It is also reasonable to emphasize the area of the third-party services and a continuously increasing volume of AWS, Amazon’s innovative project. It is a commercial, public clouding service that allows its international users to store and share information quickly and conveniently. This information demonstrates that the organization does its best to meet the customer’s expectations and satisfy their needs. In addition to that, one should mention that the COVID-19 pandemic has brought self-isolation and lockdown. These two phenomena keep moving up the volumes of online sales, leading to essential benefits for Amazon.
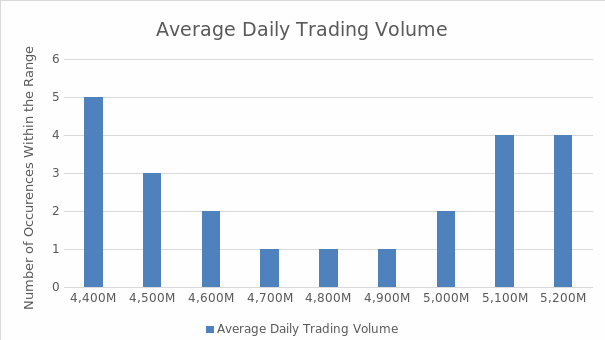
Thus, it is reasonable to analyze additional economic indicators that can describe the company’s performance. Figure 1.3 is based on the data by YCharts (2020) and draws attention to the average daily trading volume of Amazon shares. The x-axis demonstrates how many shares are traded every day, and the y-axis depicts the number of occurrences of daily trading volume falling within the stipulated range. The given histogram represents a sample size of 23 values that cover the period from September 4 till October 7. The graph is close to a symmetrical U-shaped form, which allows supposing that the mean and the median will be almost identical. This histogram denotes that the business under consideration has witnessed a decrease in the average daily trading volume, but it has managed to cope with this problem. It implies that the market associates Amazon’s shares with security which leads to lower volatility levels, attracting more investors to the company.
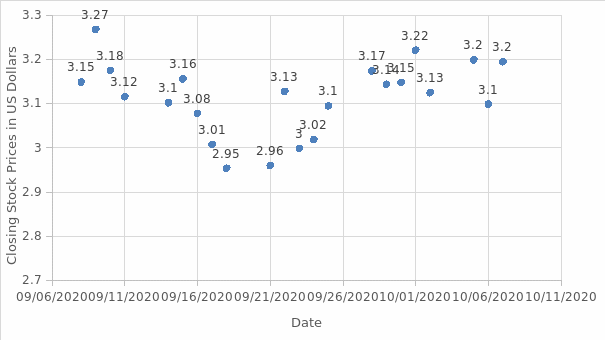
Finally, it is also rational to comment on Amazon closing stock prices that represent the last price for a stock on a trading day. Figure 1.4 illustrates a scatterplot based on the data by Macrotrends (2020) and shows how this economic indicator has changed over a month. The x-axis offers the dates, while the y-axis introduced the closing stock prices. The shape of the graph demonstrates that symmetrical development is not present. The first part of the scatterplot represents a negative correlation. Thus, September 18, 2020, witnessed the lowest closing price of $2,954 during the last month (Macrotrends, 2020). Since then, this economic indicator has started growing, and it is possible to identify a positive correlation, but it is reasonable to emphasize the cases of decreases in the closing stock price. Since most of the graph is above its median, it supports the idea above that investors, traders, and financial institutions express more significant interest in Amazon’s stocks irrespective of the unstable external environment. Thus, it is possible to conclude that Amazon is an attractive asset in the modern world.
Descriptive Statistics
Mean, Median, and Standard Deviation of Average Daily Trading Volume
The mean shows the average value of a data set. The mean of Amazon’s average daily trading volume is 4,837 million, which supports the idea that the company is a requested asset in the market. This value is in accordance with the company’s continuously increasing revenue. Simultaneously, the median stands for an economic indicator that represents the middle point of a particular data set. As for Amazon, this value is 4,878 million shares traded daily. Even though it has been mentioned that a U-shaped graph should have an identical mean and median, the given figures deny this idea. However, a closer analysis of the data set reveals that both the mean and the median are in the middle of the sample size, meaning that the same number of values surround these two indices on both ends of the distribution. This fact supports the claim that the distribution is almost symmetric.
Moreover, one should comment on the standard deviation referring to the average daily trading volume. This economic indicator is 308, which is equal to 6.4%, concerning the mean of 4,837 million. The standard deviation is useful because it can show whether the given data set is consistent. Thus, 6.4% demonstrates that Amazon’s stock’s volume stands for a reliable data set, which can be a characteristic feature of the company’s stable performance in the market. This information reveals that Amazon’s shares still remain a requested asset in the unstable market.
Mean, Median, and Standard Deviation of Closing Stock Prices
The mean of Amazon’s closing stock prices is $3,114, which justifies the business’s profitable position in the market. This value is in accordance with the company’s continuously increasing revenue. Referring to Amazon’s closing stock prices, the median is $3,125-$3,128. The comparison of the two values demonstrates that the median is higher than the mean, which is a typical feature of left-skewed data distribution. Even though the scatterplot resembles a U-shaped distribution, the essential difference between the mean and the median demonstrates the real picture. This correlation indicates that the data set has some outliers on the lower side of the closing stock prices. In other words, some asymmetry can be found in the distribution of values, which is indicative of Amazon’s stock price fluctuations.
It is also reasonable to draw attention to the standard deviation of the given data set. Appropriate calculations have revealed that the given economic value refers to 81. Considering the fact that the mean is $3,114, the standard deviation constitutes 2.6%. This fact demonstrates that the given graph implies a 2.6%-volatility. It means that Amazon’s closing stock price does not witness significant volatility, which can indicate a moderate risk of purchasing the company’s shares. Consequently, these calculations explain why investors, traders, and financial institutions tend to express confidence in Amazon and keep investing their resources in the company.
Conclusion
The graphical representation of data and appropriate calculations can provide the company’s management with useful information to understand its business position in the market. To begin with, one should present a few significant trends about which Amazon’s leaders should be aware. They are as follows:
- The business witnessed a significant decrease in the average daily trading volume and the closing stock prices in mid-September. Since then and till early October, these economic indicators were gradually rising.
- The volatility of 6.4% for the average daily trading volume shows Amazon remains the requested asset among investors, traders, and various financial institutions.
- The volatility of 2.6% for the closing stock prices reveals that the company deals with a moderate risk, which is also a positive indicator of Amazon’s performance.
The information above is useful because it can help inform business decisions. It refers to the fact that both the histogram and the scatterplot demonstrate that Amazon experienced some early October growth. Even though the market conditions are not stable, the graphs above show that the company should not take a cautious approach. Instead of it, the continuous increase in e-commerce volumes allow Amazon to reckon on a surplus in the near future.
The interpretations above allow production implications for the practical business context. Since the histogram has indicated that Amazon impresses with the high average daily trading volume, its stock has high liquidity. This information means that there are and will be many traders who will work with Amazon shares. It denotes that the business has an opportunity to increase its share prices, which will inevitably lead to obtaining higher revenue. Thus, the scatterplot of the closing stock prices has revealed that the company successfully implements this strategy.
References
Amazon. (2020). Amazon’s economic impact in the US. Web.
Evans, B. (2020). Amazon’s profits, AWS, and advertising. Web.
Kim, E., & Su, R. (2019). 25 charts that show Amazon’s explosive growth over the past decade. Business Insider. Web.
Macrotrends. (2020). Amazon – 23 year stock price history. Web.
YCharts. (2020). Amazon.com 30-day average daily volume. Web.