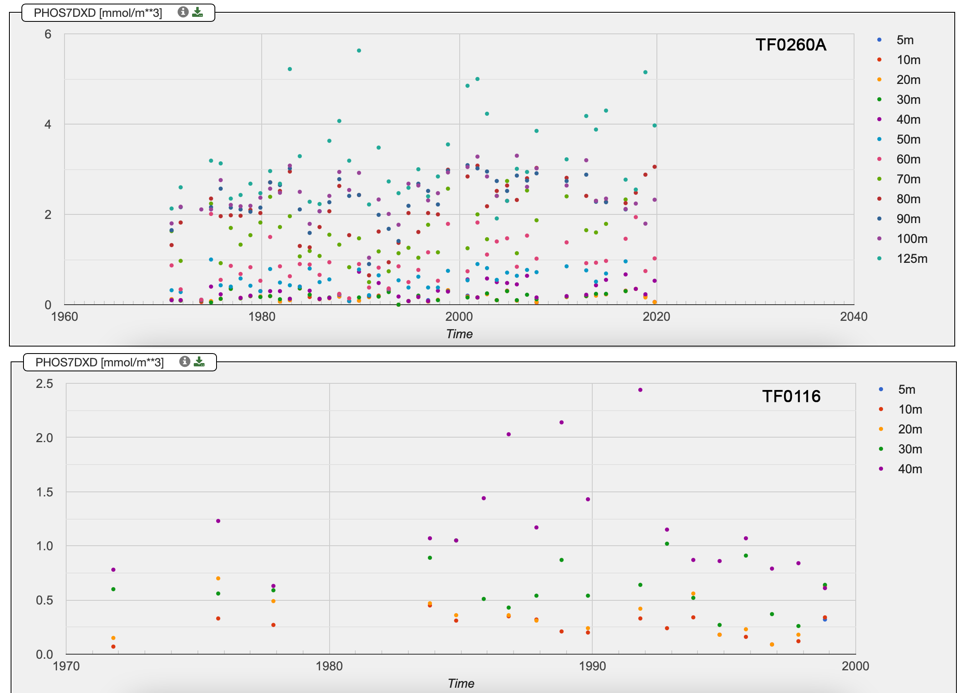
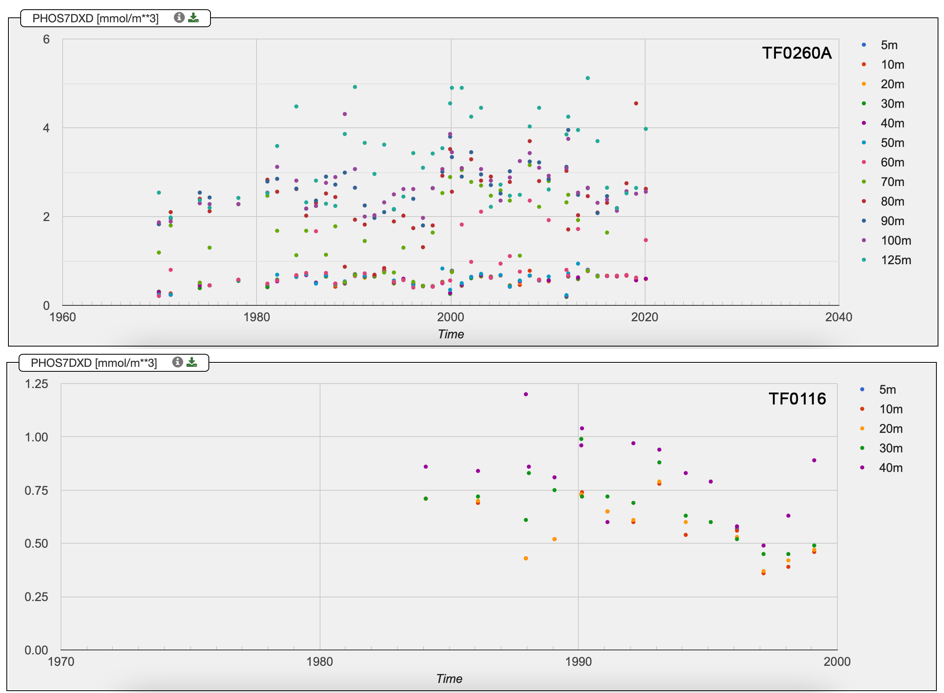
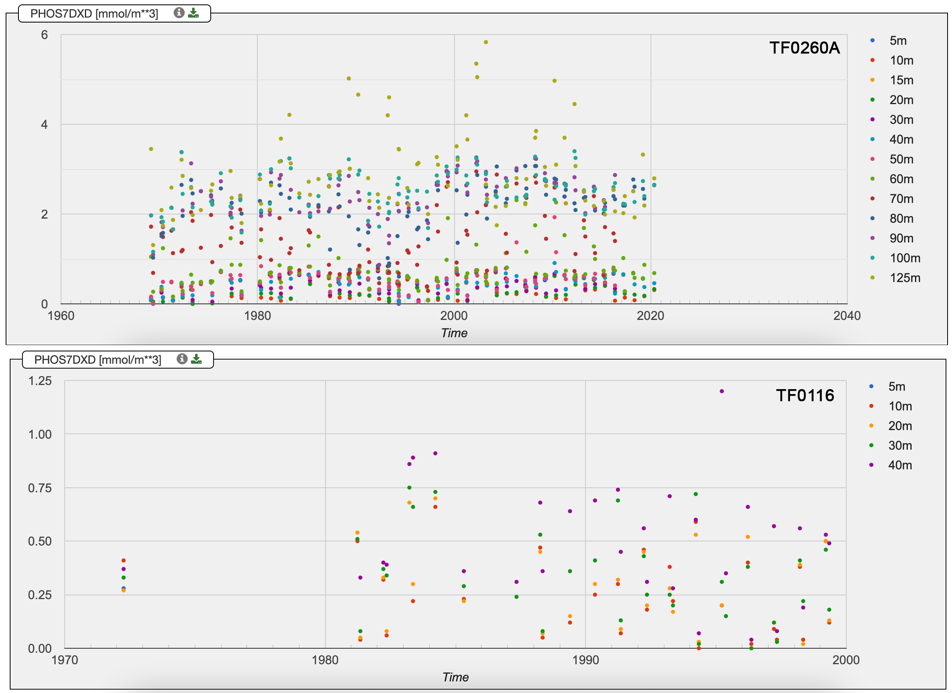
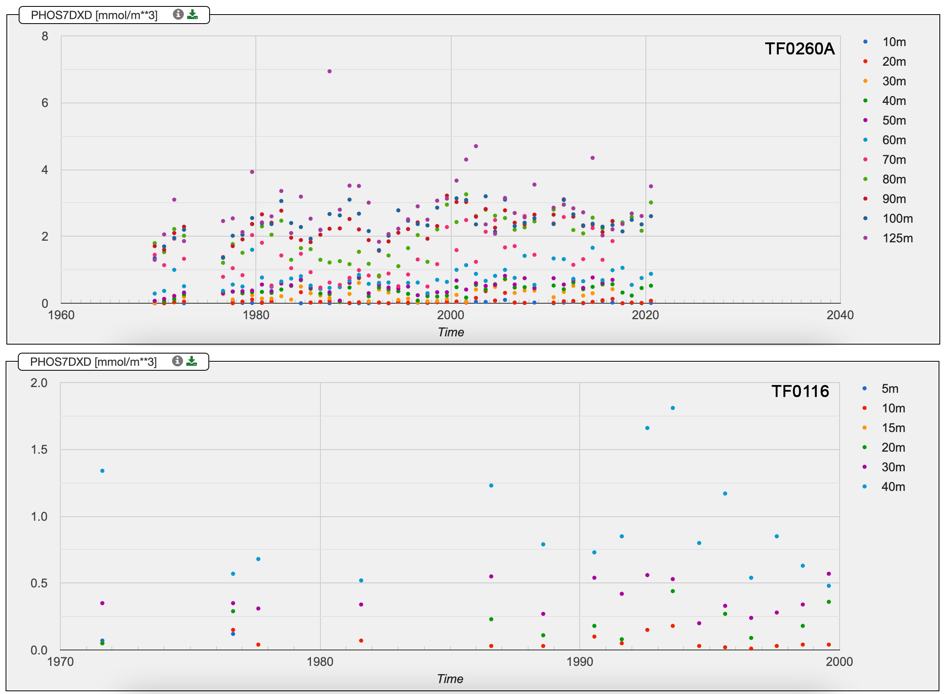
The numerical data that were provided in the manual for this assignment were automatically visualized in a two-dimensional graph illustrating the dependence of the concentration of pollutant compounds, phosphate, on the depth of occurrence as a function of the season for the two sites studied, TF0260A and TF0116. Images of all four dependencies are presented in Appendix A. A closer examination of the images highlights some key patterns that may provide useful information for ecological monitoring of the sites.
First of all, the study of maximum and minimum phosphate concentration values for a certain (in mmol/m3) depending on the season is to be discussed. So, for example, in autumn time, the highest concentration of substances was at 125 m for TF0260A and 40 m for TF0116. At the same time, the lowest concentration values for TF0260A were characteristic of the 20-40 m depth range and for TF0116, of the 10-20 m range. During winter, for TF0260A: depth 125 m (maximum) and 40-50 m (minimum); for TF0116, 40 m (maximum) and 10-20 m (minimum). For the spring, TF0260A had a maximum of 125 m and a minimum of 40 m, whereas, for TF0116, the maximum was 40 m, and the minimum was 10-20 m. Finally, in the summer, the situation was slightly different: TF0260A had a maximum at 125 m and a minimum at 10-20 m, whereas for TF0116, the maximum was 40 m and the minimum was 10 m.
In the aquatic environment, biological and physical factors influencing the distribution of phosphate concentrations can be natural or anthropogenic. High phosphate values are characteristic of intentional pollution associated with agricultural or industrial wastes (Wan et al., 2020). The ion-exchange mechanism that takes place between phosphorus mineral-organic forms and organisms inhabiting the environment also plays an important role: high concentrations of benthic phosphate can be associated with an abundance of life there. Spatial phosphate eutrophication may also be related to the flourishing of cyanobacteria.
Having carefully examined the data on the spatial distribution of temperatures collected in the first assignment, it is appropriate to assume that, at first glance, no correlation has been established. Expressly, correlation is commonly understood as a statistical relationship in which when one variable increases, the other variable changes in a pattern (Hayes & Westfall, 2020). In this sense, it would be fair to assume that an increase in layer temperature might have been associated with an increase in phosphate, for example, because it stimulated plant development and growth. In reality, however, a generalization of the two assignments might yield Table 1.
Table 1. Summary of peak values for temperature and phosphate concentration on TF0260A.
It is accurate to say that the highest phosphate concentration relevant to the reservoir’s near-bottom areas is not related to temperature maxima or minima. According to the first assignment materials, at this level, the height was maintained just below the average temperature throughout the year. It is possible to identify some patterns in the relationship between the two variables — for instance, in winter, the minimum values of temperature and phosphate concentrations were true for the 40-50 m level — but these are only exceptional cases. In general, it can be stated that no relationship was found between reservoir temperature and the amount of phosphate: apparently, the layer’s temperature does not affect the phosphate concentration. For site TF0116, a comparison of peak phosphate and oxygen concentrations is presented in Table 2.
A strong negative correlation is noticeable for these variables: the depth where the amount of oxygen was maximum had the lowest phosphate concentration and vice versa. Apparently, this trend is related to phosphorus’s chemical nature: the more of it, the more it causes oxygen reduction due to eutrophication (“Phosphorus and water,” n.d.). In other words, dissolved oxygen was converted to other ionic forms by the presence of phosphates.
Table 2. Summary of peak values for oxygen and phosphate concentration on TF0260A.
Indeed, phosphate content in water may be related to other metrics that have not yet been studied in these papers. A more in-depth study of them, accompanied by a reading of the scientific literature, provides insight into the phosphorus cycle in nature and how the element enters and concentrates in the water. The first such parameter is the quantity and quality of algae. It is known that the greater the biodiversity of algae and the longer their bodies, the more phosphate is contained in their environment (Koh, 2019).
On the other hand, a useful metric for detecting connectivity can be studying the terrain in which a body of water is located. For example, areas where mountain ranges and mines are located can be sources of phosphorus since elements can be deposited on the water’s surface when it weathers (“Why monitor phosphate,” 2017). Furthermore, it should be noted that this mechanism is most likely for the summer season when the water is not covered by snow, and the winds remove most of the rock from the mountains. At the same time, during the winter season, no rainfall is formed, which means that the probability of ingress of phosphate particles suspended in the air is minimized.
In addition, if the coastal areas are actively used as arable land, we can expect that in the spring and autumn period, a large number of phosphates can be found in the water. This is due to both diffuse contaminations from the soil, where phosphate has entered as fertilizer, and artificial discharge of waste into the water body (Green, 2018). Moreover, it is not necessarily the case that phosphate concentrations must be elevated locally near the shore: many treatment plants have relatively long pipelines capable of discharging tons of waste containing phosphates dozens of kilometers from the shore.
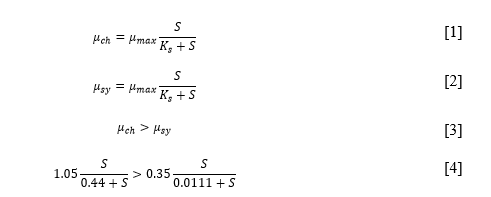
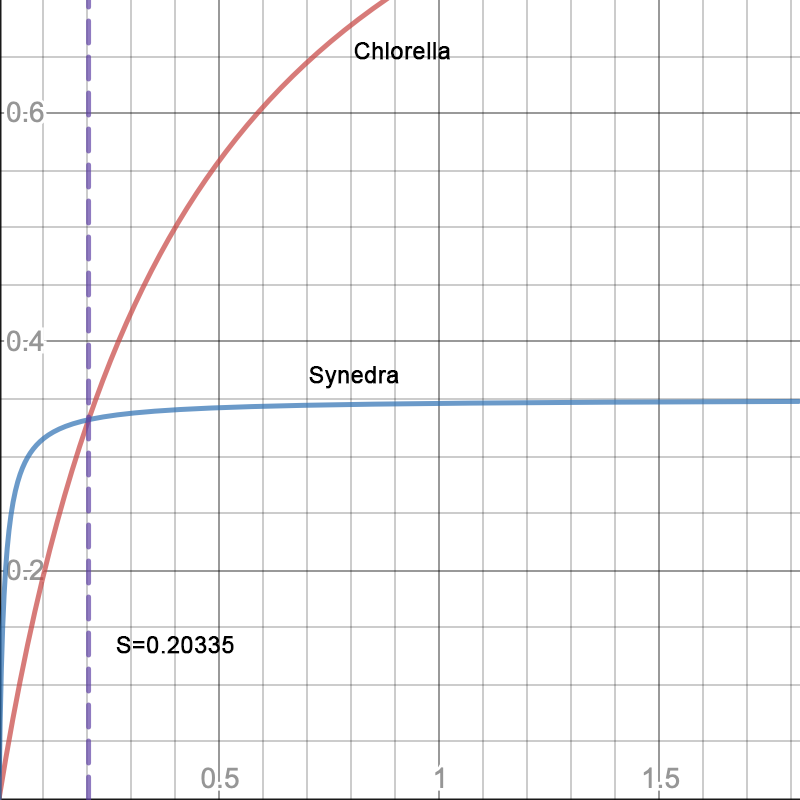
The analysis of two algal species, Chlorella and Synedra, is presented in this section. More specifically, the assignment gives information about the values of the max. specific growth rate and the Monod constant. The maximum specific growth rate of Chlorella was 1.05 d-1, whereas, for Synedra, this value was almost three times less, at 0.35 d-1. Based on these data alone, we can conclude that a Chlorella colony would grow on average three times as much as a Synedra colony during the same time interval. Simultaneously, the half-saturation constant of phosphate for the two species is 0.44 μM for Chlorella and almost forty times lower for Synedra: only 0.0111 μM.
Biologically, this value defines the substrate concentration at which the population growth rate is half of the maximum. The formulas [1] and [2] are used to calculate each population’s specific growth rate. By convention, the growth rate of Chlorella must exceed the growth rate of Synedra, and therefore the statement shown in [3] is valid. Then, by substituting the exact data, we can obtain the equation [4]. By solving this inequality, it is not difficult to understand that starting from the phosphate concentration equal to 0.20335 μM, the specific growth rate of Chlorella will exceed the growth rate of Synedra..
References
Green, J. (2018). How do phosphates affect water quality? Sciencing.
Hayes, A. & Westfall, P. Correlation. Investopedia. Web.
Koh, H. S. (2019). Using algal biomass-phosphorus (P) relationships and nutrient limitation theory to evaluate the adequacy of P water quality criteria for regulated monsoon rivers and reservoirs. Chemistry and Ecology, 35(5), 408-430.
Phosphorus and water. (n.d.). USGS. Web.
Wan, J., Yuan, X., Han, L., Ye, H., & Yang, X. (2020). Characteristics and distribution of organic phosphorus fractions in the surface sediments of the inflow rivers around Hongze Lake, China. International Journal of Environmental Research and Public Health, 17(2), 648-664. Web.
Why monitor phosphate levels in water? (2017). EMS. Web.
Appendix A
Visualization of Concentration Data for Two Sites as a Function of Season