Introduction
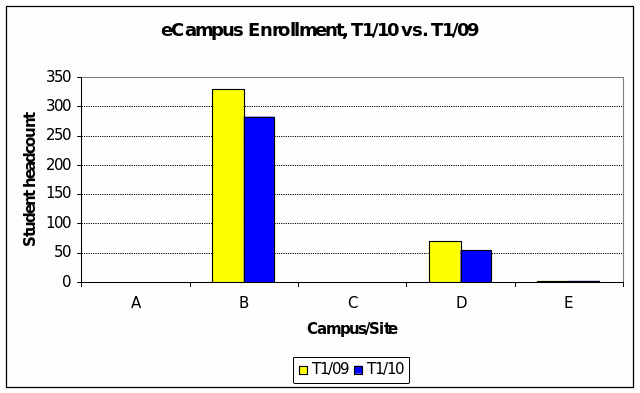
In term 1/2010, aggregate enrollment shrank palpably by 14% or from 410 in the corresponding period last year to 354 this year. Since eCampus enrollment accounted for at least 95% of the total in both periods, changes in the headcount here loomed large. The loss of aggregate enrollment occurred across both active campuses B and D (see Fig. 2 overleaf). True, campus E showed no erosion in eCampus headcount from one term to the next but the numbers involved, just 2 students each time, are so marginal as not to count in the overall scheme of things.
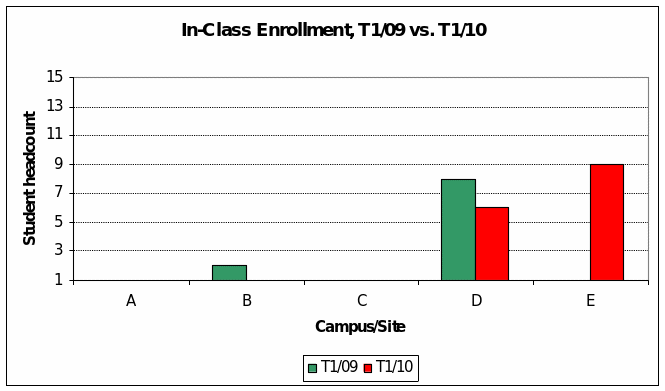
Since in-campus enrollment is generally very low, small changes are magnified. For some reason, even the minuscule campus B enrollment of two students last year disappeared (Figure 1), presumably in favor of attending to a sizeable online student body (Figure 2).
Site D continued to attract a small number of in-class students and site E did the best in the 2010 term, coming out of nowhere in the 2009 term to boast all of nine students this time around.
New Starts, T1/09 and T1/10
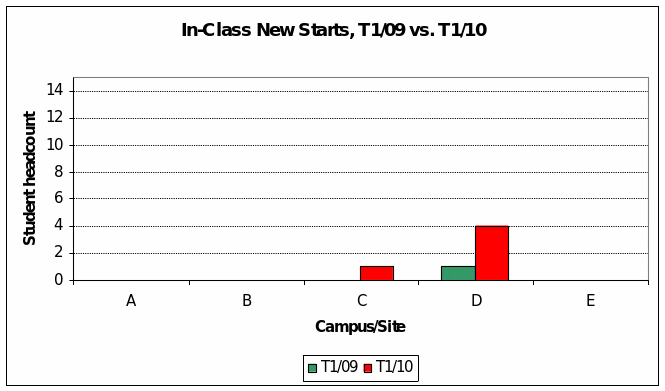
Campus D registered more new starts in 2010 compared to the prior year, largely explaining the growth in total enrollment (Fig. 3 overleaf). Otherwise, the data seems to reveal a fluke for campus C: 1 new start this term versus zero total enrollment.
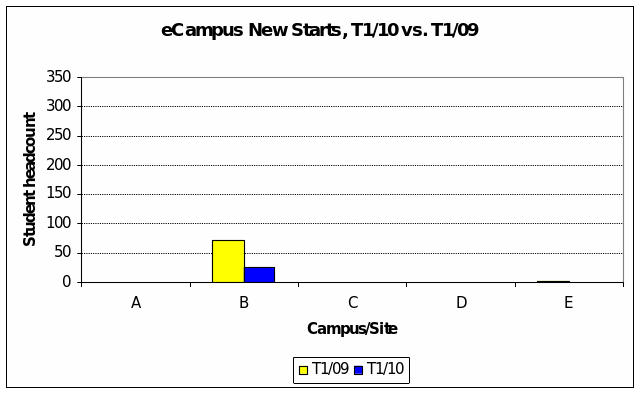
Online new starts shrank in term 1, by two-thirds for campus B and from a minuscule 2 online students last year to nothing at all in the case of campus E (Figure 4 above).
Total Enrollments, Term 2, 2009 and 2010
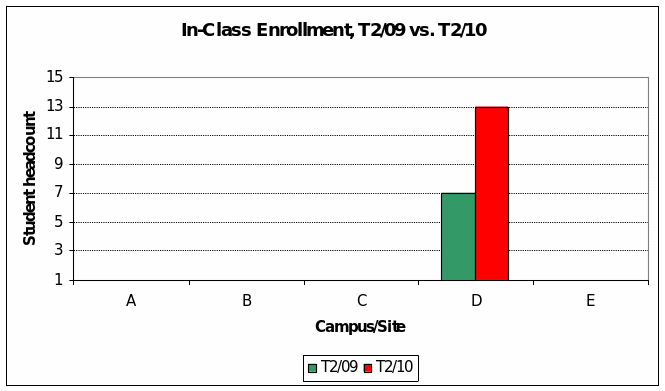
In term 2, only campus D had any in-class enrollment to show for it. The puny student population of seven in the same period last year nearly doubled in T2/2010.
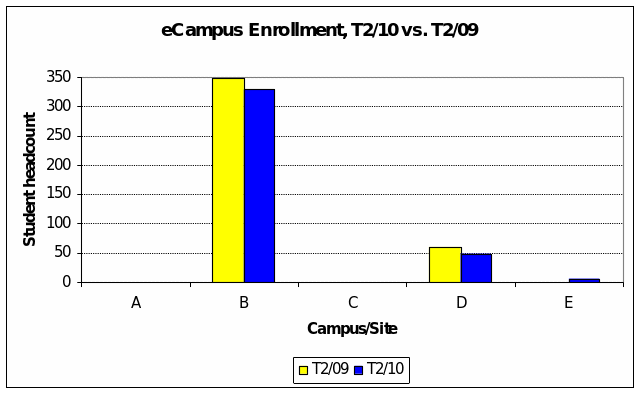
The online situation firmed up in term 2 (Fig. 6 overleaf), very much as it did last year when eCampus enrollment at campus B reached the system-wide high of 350 students, the best attained in the two years under review. Though gross enrollment numbers still shrank, campus B online students were off just 6 percent from last year’s record. Campus D remained a distant second in eCampus enrollment this year. Online enrollment at this site fell proportionately faster than at site B, but the reality is that the reduction of ten students in campus D enrollment impacts system-wide performance less than the fall-off of 21 students at campus B.
New Starts, Term 2, 2009 and 2010
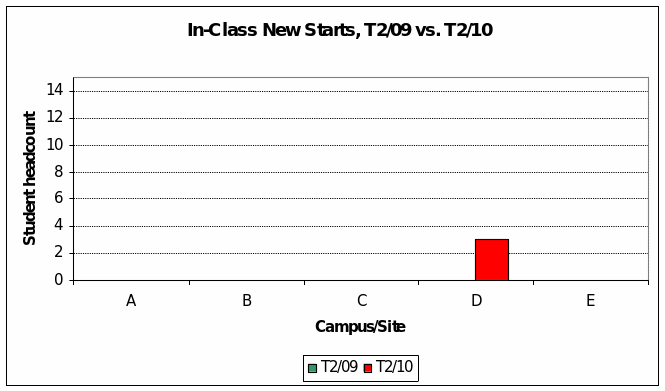
In term 2, only campus D had any in-class new starts (Fig. 7 overleaf). In fact this site performed satisfactorily in this respect all the way to term 4. As well, new starts of 3 compares favorably with absolutely nothing in term 2/2009.
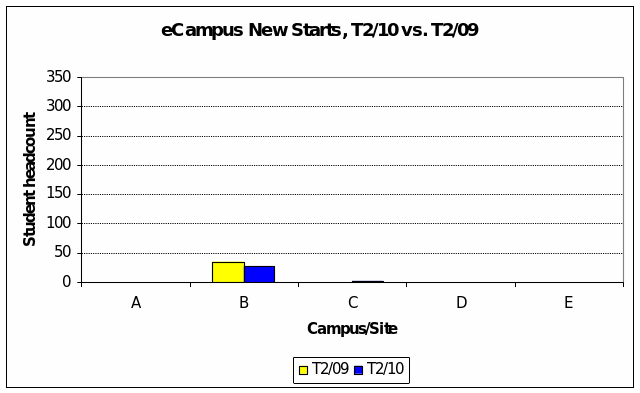
Term 2 was also a comparatively parched season for online e new starts (Fig. 8 overleaf). Only campus B recorded any tangible inflow, albeit new eCampus registration this year were off around 22 percent from prior-year levels. For the rest, site C garnered just one online new start.
Total Enrollments, Term 3, 2009 and 2010
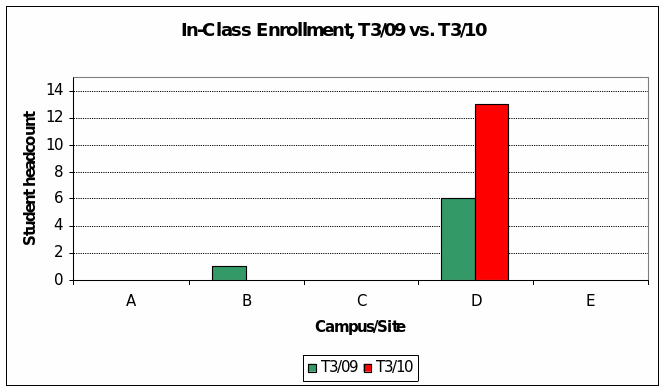
In term 3, site D continued to outpace all others where in-class student body was concerned (Fig. 9 below). Though the numbers are low, gross enrollments were more than double where they stood in the same period last year. In T3/2009, campus B had had one solitary student but accepted no one at all this year.
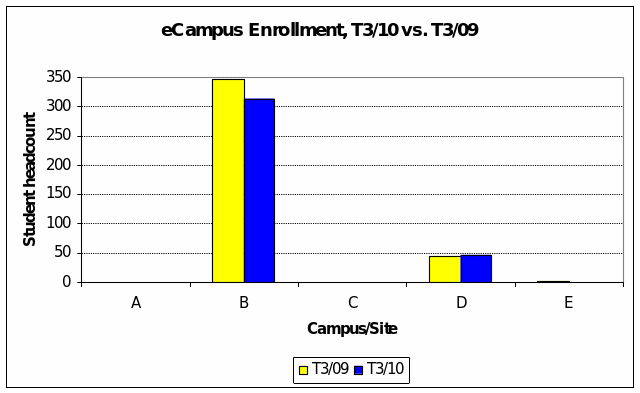
Instead, site B continued to set the pace for online enrollment (Fig. 10 overleaf). The eCampus student population was less than 10 percent off the near-record achieved in the same period last year. Site D may have achieved the rare feat of being 6 percent up on last year’s online enrollment (the chart scale in Fig. 10 obscures the fact that the numbers rose from 44 to 47). Still, the eCampus student body at the latter was only a fraction (15%) of the volume campus B boasted.
New Starts, Term 3, 2009 and 2010
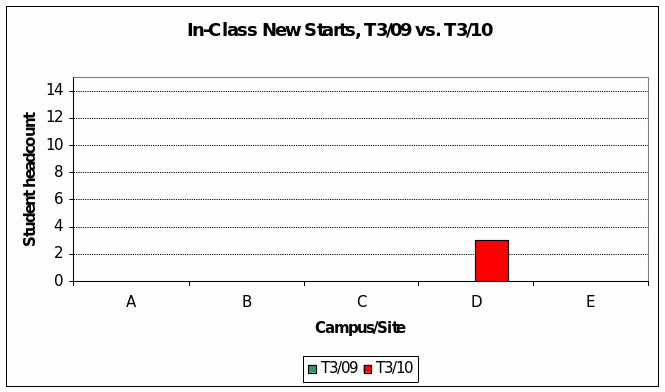
Only campus D had any new in-class starts at all in term 3 (Fig. 11 overleaf). Still, even this puny number of three stood better than in the 2009 term when none of the campuses recorded any new enrollments.
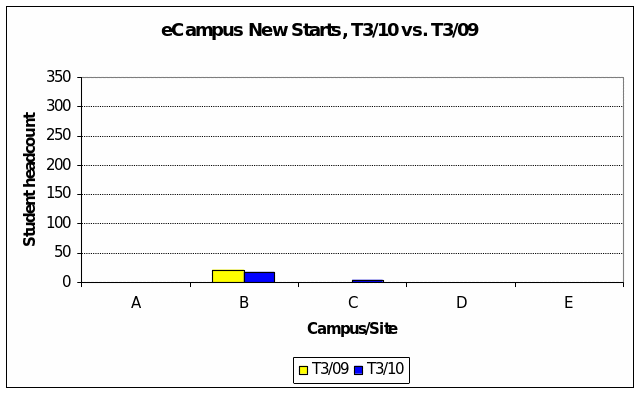
Online inflows this term were similarly sparse, about the same situation as prevailed in the equivalent term of 2009. Campus C did get three new online enrollments, but this did not fully compensate for the fact that eCampus new starts at site B fell off from 21 to 17 (Fig. 12 overleaf).
Total Enrollments, Term 4, 2009 and 2010
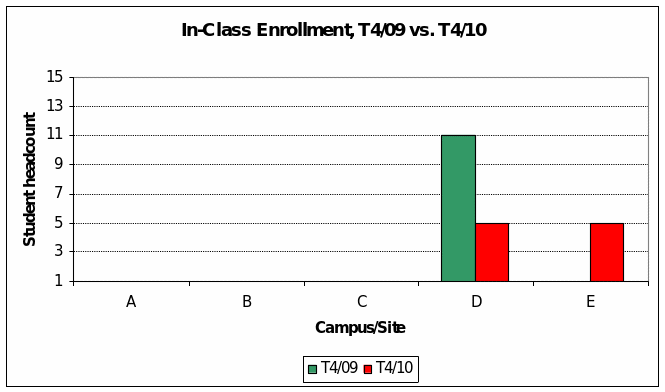
By term 4, aggregate in-class enrollment this year stood at just ten. That site E had half of this versus nothing last year (Fig. 13 below) barely made up for the erosion experienced by campus D.
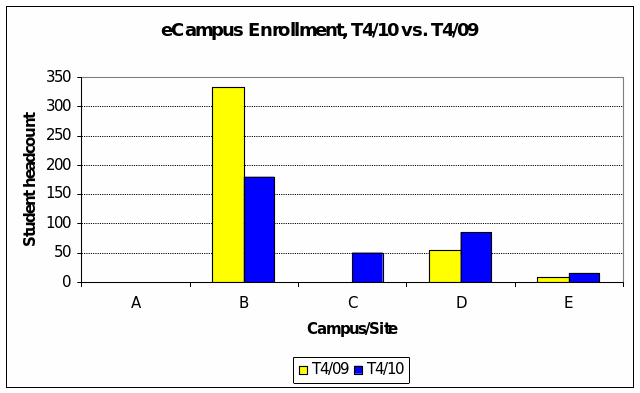
As to eCampus enrollment, sites C, D and E (in that order) did tangibly better compared to term 4 the prior year (Fig. 14 overleaf). However, these gains did not make up for the near-halving of online enrollment that campus B suffered.
New Starts, Term 4, 2009 and 2010
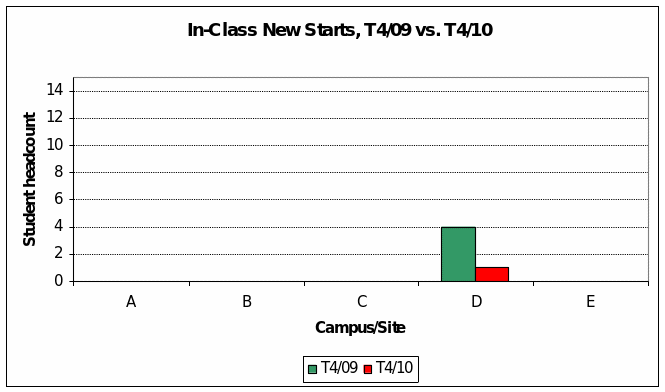
Once again, only campus D recorded any fresh enrollment activity for in-class students (Fig. 15 overleaf). The picture was made even bleaker by the fact that new starts this term shrank from four the prior year to a solitary new enrollment in 2010.
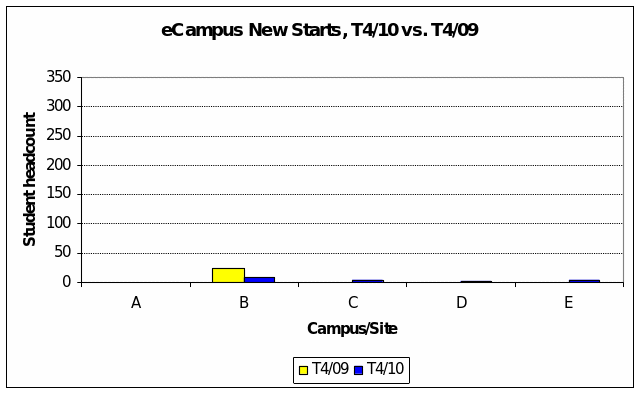
Sites C, D and E accepted token numbers of newly-enrolling students for online courses (Fig. 16 overleaf). But these failed to make up for the two-thirds loss campus B endured compared to the same term in 2009.
Total Enrollments, Term 5, 2009 and 2010
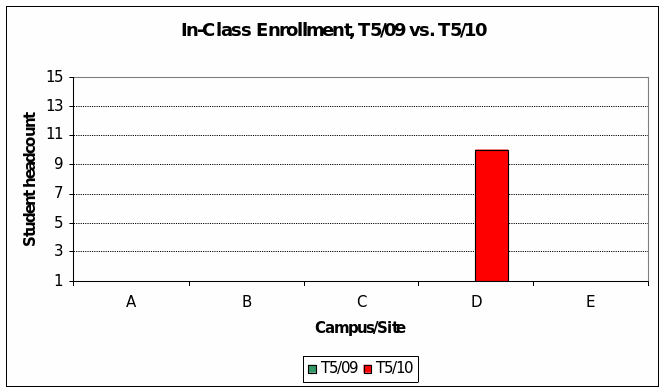
By the fifth term of 2010, campus D held steady with an in-class student body of ten compared to nothing at all for all other sites and a similarly dismal showing in 2009 (Fig. 17 below).
As the year closed, eCampus enrollment continued to droop. Gains at sites C and E (Fig. 18 overleaf) could not make up for the marginal loss at site D and the near-halving of online enrollment at campus B.