Introduction
As the areas selected for improvements include reducing patients’ length of stay in the community hospital and making sure readmission rates are not increasing, it is necessary to choose the necessary tools to measure these improvements. So, the main area of research is the VA hospitals that are facing Managed Care provided by means of Utilization Management Service performed in the community. The Veterans Affairs hospitals are aimed at bringing the veterans back to VA hospitals from the community hospitals with the help of managed care. This change will reduce the costs spent by patients with the help of the improvements mentioned above.
Data Needed to Monitor the Improvement
Data needed to monitor the improvement can include sets of information related to the staff members and patients. In this respect, it is necessary to focus on definite types of data that can be really influential for monitoring and measuring the improvements such as reducing patients’ length of stay in the community hospital and making sure readmission rates are not increasing. In other words, the data can include the period for which patients stayed in the hospital before the implementation of managed care program.
Tools for Collecting Performance Information
Tool one
National Healthcare Quality Report (NHQR) Fact Sheet
Type of information it collects
This tool helps to collect information on the effectiveness of performance by health care agencies and institutions of different types. Measures of treatment and various preventive methods can be monitored when they are used in various health care institutions. In this respect, the VA hospitals’ performance effectiveness can be monitored in the same way with the help of the Fact Sheet.
Strengths and weaknesses
The universality of this tool makes it as beneficial as lacking depth. In other words, some health care institutions would benefit more from the use of more specifying tools that enable professionals to assess specific data. Thus, the strengths and weaknesses of this tool can be considered the same features and techniques.
Tool two
Sampling (IHI Tool)
Type of information it collects
This tool helps to collect the information necessary for the implementation of changes. As most health care institutions claim to be not ready to introduce changes necessary to improve the quality of the treatment and health care services in general, they should use this tool to provide samples. The samples enable the team members to see the changes in practice without imposing risk on the real situation.
Strengths and weaknesses
The main benefit of this tool includes the possibility of monitoring the change without really introducing it whereas all results can be considered accurate. However, the scale of the situation imposes some risk on the change because the results can appear to be not as effective as the sample. So, the effectiveness of changes can be only partially measured with the help of this tool though it facilitates the process of application of new measures into the health care activity.
Tool three
Simple Data Collection Planning (IHI Tool)
Type of information it collects
This tool is necessary to plan the data collecting process. Though the main aspect of the tool used is the information collected, the process of planning this stage of the change implementation is very important as well as the management of the change. In other words, a good plan enables all the members of the team to be sure about the necessity of this or that measure or step taken.
Strengths and weaknesses
The main strength of this tool includes a set of benefits that facilitate the process of data collection, make it more time-efficient and cost-efficient as well. The necessity of taking this or that step does not impose risk on the overall change because of the well-organized plan that includes all errors that might possibly occur. Besides, knowing what errors may occur, it is easier to make changes taking into account the risk and trying to avoid it. The weaknesses of this tool are scarce to the extent that they can be put down.
Tools to Measure and Display QI Data
The following tools can be used to measure and display quality improvement data gathered after implementation of managed care in the VA hospitals aimed at bringing back veterans from community hospitals to the VA hospitals system. Measuring Rare Events and Time-Between Measures is the first tool that can be used to measure and display quality improvement data. This tool enables professionals to assess the risk and predict the occurrence of this or that rare event such as infection after a surgery or other rare events. In this respect, this tool can be helpful to take into account such aspects of health care practice as an unpredictable rare event that might occur once a year or twice a month. So, the number of infections during or after the surgery cannot be predicted through measures that can be taken to analyze the frequency of such occurrence.
Types of information each tool measures and displays
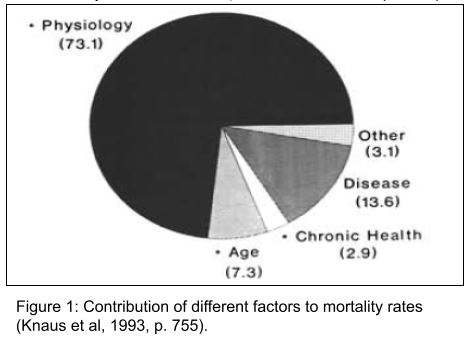
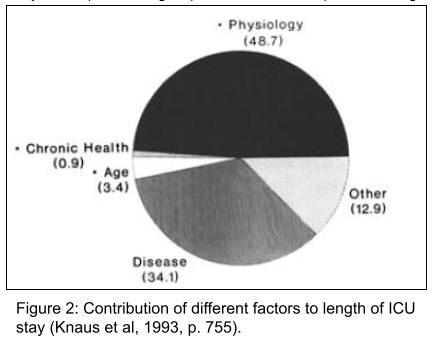
It is necessary to take into account the way in which the tool processes the data. For instance, it is possible to use the way used by the group of researchers who claim “To calculate a risk-adjusted mortality rate for each ICU, we added individual patient predictions using the cross-validated equations and then calculated a standardized mortality ratio by dividing actual by mean predicted group death rate at hospital discharge” (Knaus et al. 1993, p. 754).
The same can be said about the next tool that may help researchers to measure and display quality improvement data. Scatter Diagram (IHI Tool) is aimed at comparing and contrasting two variables with the help of a graphic presentation that enables all parties concerned to see the effect of changes in a diagram.
Each tool’s strengths and weaknesses
Strengths of the first tool (Measuring Rare Events and Time-Between Measures) include the importance of such toll due to the inability of people to be always ready for emergency situations. Besides, analysis of data provided with the help of this tool can be really beneficial for professionals that deal with emergency situations such as surgical site infections and other rare events that are not easily predictable. As suggested by Ashton et al. (1995), the quality of inpatient care is closely related to the early readmission rates. In this respect, it is necessary to trace the quality of improvement with the help of measuring the rate of early readmissions in different periods of time.
Similarities and differences of tools
Ransom et al. (2008, p. 11) suggest the use of six dimensions to monitor and measure the effectiveness of quality improvements. At the same time, Dlugacz (2006, p. 74) mentions the use of the six sigma approach to improving the cost-efficiency of services provided by health care institutions. The tool for measuring and displaying the quality improvement data should include the length of stay, the quality of services according to surveys conducted for patients and health care institution staff, and other factors such as cost of services and changes in the cost of services provided after implementation of improvements.
The benefit of these tools for healthcare organizations
The main benefit of monitoring, measuring, and displaying the quality improvement data can be further improvement of health care services provided in VA hospitals contrasted to community hospitals that are not specialized for this purpose. Moreover, the readmission rates and the quality of care provided are closely related. So, it is necessary to assess different factors before the implementation of changes and after in order to ensure that the improvements really work.
Conclusion
All changes implemented in VA hospitals to bring the veterans back from community hospitals are aimed at improving the conditions for patients and health care providers and reducing the costs spent on each treatment measure, acute care as well as decreasing the period spent at hospital in case of readmission and the possibility of readmission. Every change should be measured and monitored in order to learn more about some mistakes and variables that cannot be taken into account in theory while may occur in practice. So, different tools that help to gather the data, analyze the effectiveness of different measures, and monitor the improvements were assessed in the current research.
Reference List
Ashton, C. M., Kuykendall, D. H., Johnson, M. L., Wray, N. P., and Wu, L. (1995). The association between the quality of inpatient care and early readmission. Annals of Internal Medicine, 122 (6), 415-421.
Chertow, G. M., Burdick, E., Honour, M., Bonventre, J. V., and Bates, D. W. (2005). Acute kidney injury, mortality, length of stay, and costs in hospitalized patients. Journal of the American Society of Nephrology, 16, 3365–3370.
Dlugacz, D. (2006). Measuring health care: Using quality data for operational, financial and clinical improvement. San Francisco, CA: Jossey Bass.
Knaus, W. A., Wagner, D. P., Zimmerman, J. E., and Draper, E. A. (1993). Variations in mortality and length of stay in intensive care units. Annals of Internal Medicine, 118 (10), 753-761.
Ransom, E. R., Joshi, M. S., Nash, D. B., and Ransom, S. B. (2008). The healthcare quality book: Vision, strategy, and tools (2nd ed.). Chicago, IL: Health Administration Press.