Introduction
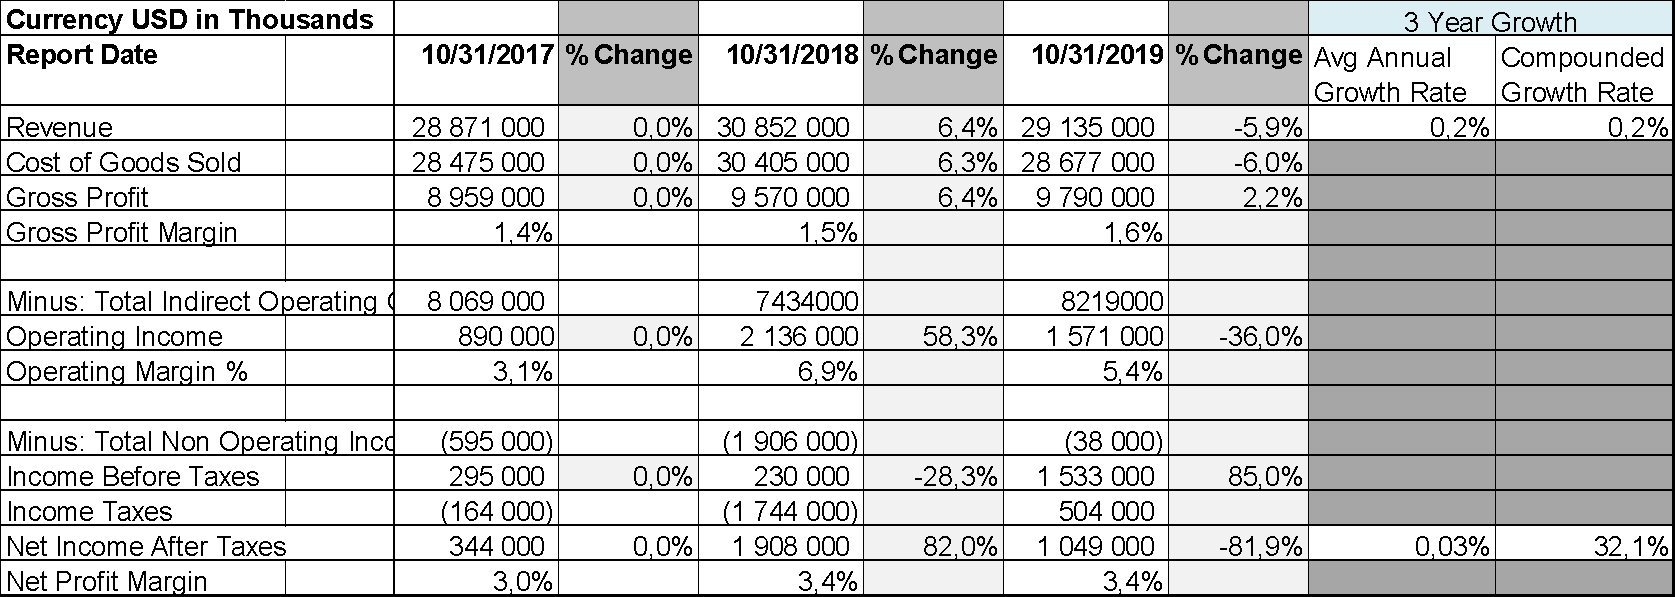
The conducted research indicates that the selected company faces several issues in managing the financial health. The company’s balance sheet and income statements reveal that the last three years have been less profitable for the company, as revenue statements and net income statements are decreasing from year to year. In this case, the review of several financial coefficients may indicate problematic fields within the company.
Profitability and Efficiency Ratios
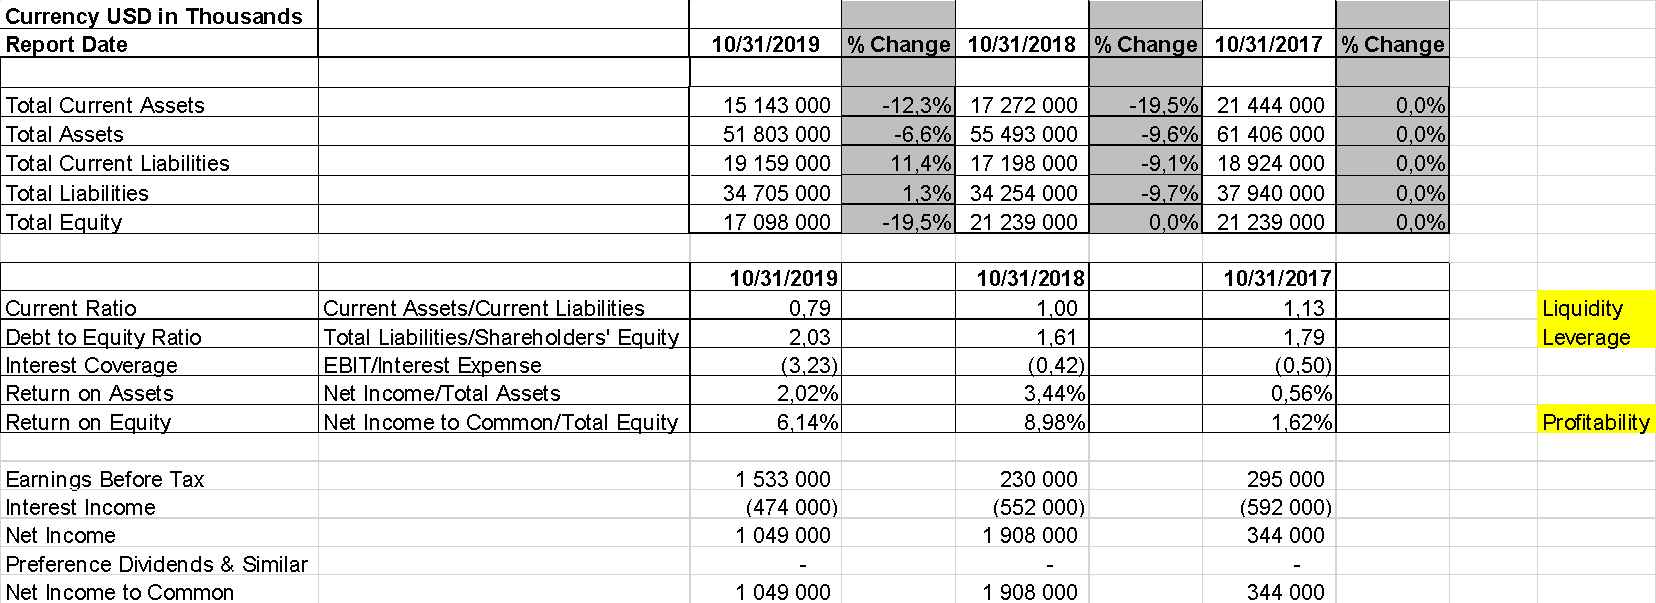
Any profitability ratio is a measure of the performance of managers. Profit ratios are linked to the income statement and balance sheet (Brooks, 2019). Besides, it serves as a measure of the effectiveness of equity or equity transactions. The company has 6.14% of profitability in 2019, which is less than the average industry coefficient. The significant hike between 2017 and 2018 shows that profitability rapidly grew from 1.62% to 8.98% due to the market success of Hewlett Packard. On the contrary, in 2018, the profitability ratio was almost 9%, meaning that the company is not doing well regarding its financial sustainability. Such a situation indicates that in the next couple of years, the company may have financial issues when assets do not cover liabilities, encouraging the company to take more loans or close some markets to secure the company from commercial failure.
Liquidity Ratios
Company liquidity is a measure by which a company’s ability to pay on its short-term liabilities (debts) is determined. High liquidity is secured by high current assets, current liabilities, and a high proportion of existing liquid assets represented by cash and receivables. This indicator also characterizes the ability of an enterprise to meet its short-term liabilities with the most easily realized part of assets – current assets. This ratio gives the most general assessment of asset liquidity.
The financial analysis shows that, in 2019, this ratio is less than 1 (=.79), meaning that the company has more debts than capital. In 2018, the liquidity ratio was 1, while in 2017 – 1.13. Such a decline means that the company has little manufacturing and sales powers to gain capital and increase the number of assets. The average cost of this factor is between 1.5 and 2.5, but not less than 1 (Brooks, 2019). In this case, the analysis clearly indicates the financial decay of the company, as fewer liquid assets can be utilized to attract investors and creditors. However, its level is influenced by the industry affiliation of the enterprise, the structure of inventories, the state of accounts receivable, the length of the production cycle, and other factors.
Leverage Ratio
Financial leverage (leverage) is the potential ability to influence the profit of an enterprise by changing the structure and volume of long-term liabilities. The level of impact of economic leverage indicates the financial risk of the enterprise (Brooks, 2019). The company’s leverage ratio in 2019 is 2,03. This means that the debt/equity percentage is 203%. Such a situation indicates that the company uses debts to fuel its growth and competition. In the previous years this ratio was lower: in 2018 – 1.61, and in 2017 – 1.79. Such a growth in leverage ratio suggests that the company finds it difficult to generate its own resources and capital to drive the growth. The further growth of this financial indicator will mean that the company makes a step toward default or bankruptcy.
Conclusion
The analysis of the company shows that the company has hardships with financial sustainability and adequate management of its assets and liabilities. The difference between 2018 and 2019 years indicates that the company cannot generate capital to compete on the market. The further decline of financial indicators may depict the stagnation of the company and question its survival on the market.
References
Brooks, C. (2019). Introductory econometrics for finance. UK. Cambridge university press.
Appendices