Data modeling is important in the establishment of trends of a given data set. The mathematical models can be used forecast the future implications of a given data and therefore help in planning effectively. Raw data from research might not display any particular consistent trend but can fit at least in one or two of the mathematical models. The task in this study is to develop a mathematical models which best characterizes the population of China given between 1950 and 2008. The best way of developing a model is through the use of trend lines to establish the plot of best fit. These is preceded by the modification of the functions to include the constants of the given data distribution pattern.
The models developed are visually represented using diagrammatic representation such as graphs through the use of technology like Microsoft excel. This gives a clear indication of the characteristics of the data distribution. From this platform, modifications can be done such as introduction of custom trends which has a particular mathematical model. On the other hand, a mathematical model can be plotted in order to display the distribution of a given data.
This is done by choosing constants and using the model to generate the values of the variables describing the model. This data is then plotted on a graph which enables comparison of the actual data and the model developed. The model is significant in the establishment of a sequence and therefore helps to predict data at a given earlier or later time other than the data given. Moreover through the use of these models, the data at specified time can be analytically calculated in order to facilitate generalization of the data set.
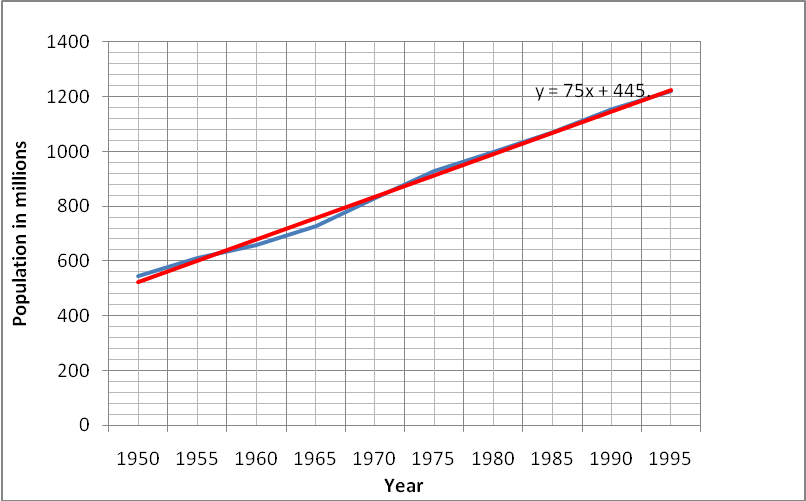
The following task is the plotting of the population against time from 1950 to 1995
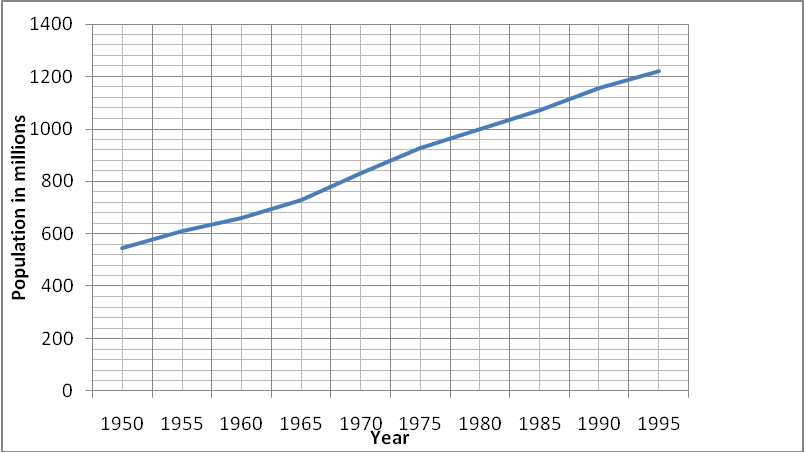
The population of China is on an increasing trend which is almost linear. The trend therefore can be said to be upward with a positive gradient.
The above trend of population can be modeled using an exponential function shown below: p=kemt
Where:
- k=initial population.
- M= rate of increase in population.
The choice of this function is because the characteristics of an exponential at the lower part of the curve there is reduced rate of increase which picks up with time.
Analytical models of the data;
Considering an exponential trend; the parameters of the above function are found by derivation of two simultaneous equations by equating the population at two given periods in the equation given below: p=kemt
The value of:
- k=508
- M=0.09
The exponential function then becomes:
y = 508e0.09x
The graph of the models developed therefore in comparison with the original data is given as shown below.
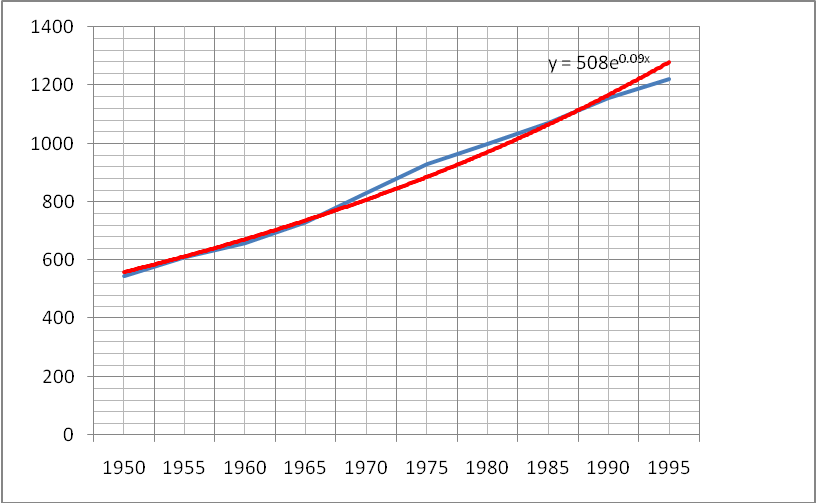
The graph is developed by first plotting the values given then on the data series a trend line is added. This is done by trying various trend lines to determine which of them best fits the characteristic curve. The equation which characterizes the model is then displayed. The model is then modified to produce one which best fits the data as shown in the above diagram. The next step is the interpretation of the constants such as the rate of increase and the y-intercept.
The model of the researcher is given as;

Definition of variables and parameters
p(t) = the population at a given time
K and L are constants which depend on the population growth pattern (McCullough and Wilson 1244).
M= the rate of population growth
The researcher’s model can be modified as show below
The above equation can be rewritten as shown below so that it can be easily interpreted and modeled easily. The main aim of doing this is to be in a position to generate a curve which best fits the modified model. The researcher’s model then can be implemented by choosing appropriate values of variables that gives close relationship with the given data enabling comparisons of the model and the actual data.
Then the above equation becomes: p(t)=k+PLm
The model developed which fits the data is y = 75x + 445.
Showing that K=445 and PLm=75
This model shown below is in the same form as shown above. The data is in blue while the model developed is in red in all graphs in this study.
The implication of this model is that the population of China is on the increase. The population of China in future therefore is predicted to be high if these models are used (Henry 47).
The trends from 1983 to 2008 from the data given is given by the figure 4
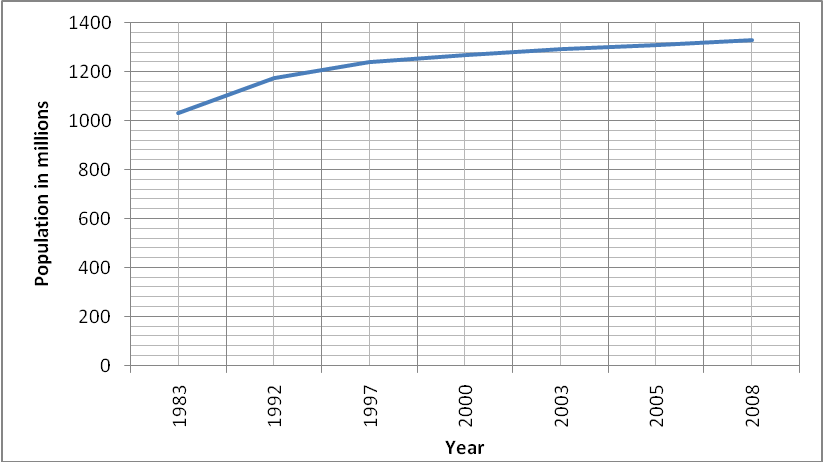
The model which best fits this pattern is given in figure five
The model is given as y = 1983.x0.006
This model is similar to that used for the data from 1950 to 1995 which is described by: p=kemt=km
Where k is the rate of increase of the population.
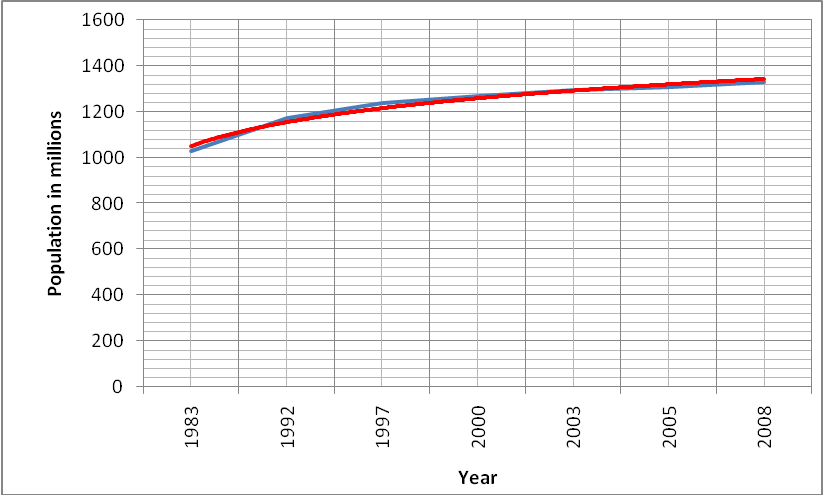
When we combine all the data from 1950 to 2008, the following is the graph of the data (McCullough and Wilson 1247).
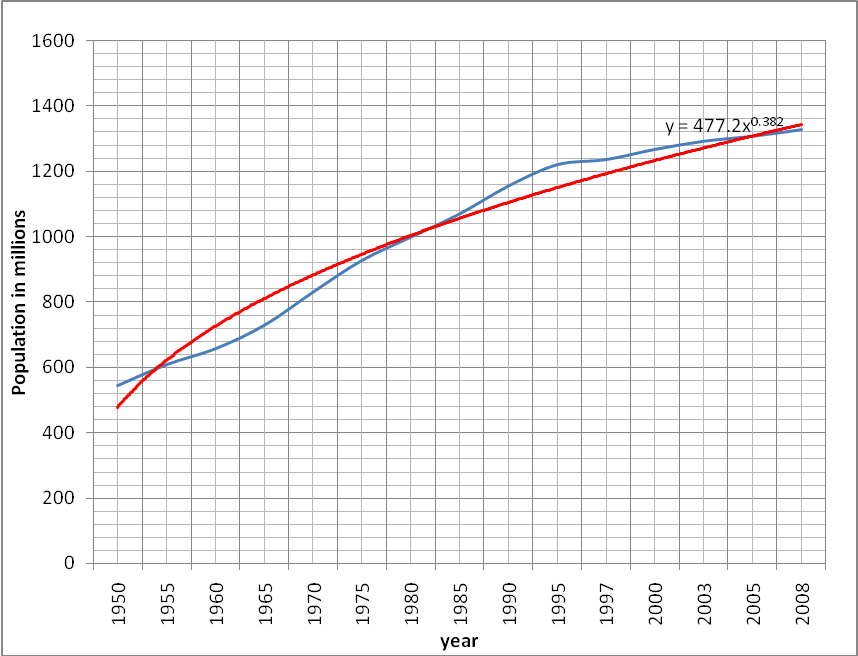
The model which fits the data therefore is given as
The model above can be modified as shown to fit the model above

Therefore the above function is in the form of the modified model and best fits the data as shown by the model below y = 489.9x0.354
The models developed in all situations shows that the models and the actual data were similar in terms of the trend. This is clear from the graphs which shows that majority of the curves developed are in tandem with the actual data. In conclusion, development of models involves creation of a curve that best fits the data given which has been accomplished in this task.
Works Cited
Henry, Gary. Graphing Data. Techniques for Display and Analysis. London: SAGE Publications, 1995. Print.
McCullough, David and Berry Wilson. “On the accuracy of statistical procedures in Microsoft Excel 2003.” Computational Statistics and Data Analysis 49.4 (2005): 1244-1252. Print.