Brief Theoretical Background
Acid Base Interaction
Chemical reactions between the molecules of acids and bases formed the foundation for the acid-base titration method, thanks to which a number of working problems related to the selection of the indicator, determination of the type of interaction, calculation of the equivalence point are solved in professional chemistry. It should be recalled that titration is a quantitative analytical method designed to determine the analyzed component of a substance (in an acid-base titration, it is acid or base, respectively) dissolved in a probe. This method is based on the visual observation of the complete chemical reaction between the analyzed component and the reagent added to the solution with a predetermined concentration.
Acids
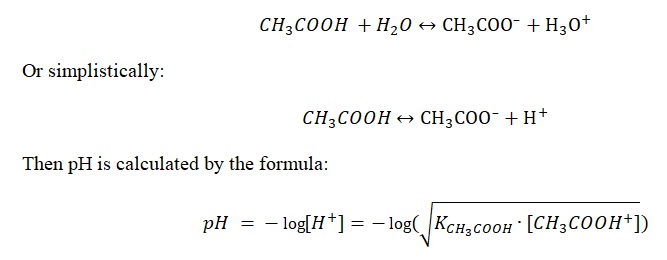
According to the principles of the theory of electrolytic dissociation, developed by Svante Arrhenius, chemical acids are traditionally understood as substances that release hydrogen ion (proton) H+ during dissociation. The second component of the complete molecule is the acid anion, which can be represented by a whole spectrum of atom groups: sulphate, sulfide, nitrate, cyanides, permanganate and others. However, the Arrhenius theory has been replaced by the supplemented Bronsted and Lowry’s theory, which concluded that acids are substances that definitely give off a proton in the interaction:
![]()
Final to date, corrections to the restrictions of the previous definitions made by Gilbert N. Lewis, who claimed that acids are electrolytes that receive electron pairs from the base, in other words, an electron acceptor.
Bases
It should be recognized that the assumptions characteristic of acids were also fair for the bases. According to the Arrhenius theory, the bases are called molecules, which at dissociation in solutions detach the hydroxide ion OH–. In the Bronsted and Lowry’s theory, the bases are substances that take isolated protons from acids, and thus are acceptors of protons. On the other hand, the bases, according to Lewis, can be considered any particles capable of giving away an electron pair to form a covalent bond: electron donor.
Acid Base Titration
According to the acid-base titration concept, during this chemical procedure, the reagent is gradually mixed with a known concentration of the analyzed component. It is known that acids and bases characterize the opposite sides of the pH scale, and therefore, this interaction naturally changes this parameter. For instance, if there is an acid in the titration unit as a component in the flask, then the drip addition of base from burette will undoubtedly increase the pH. Since the acid-base reactions are speedy, the chemical equilibrium is also immediate.
Indicators are used professionally to observe changes in the interaction in the chemical environment. Indicators are chemical molecules — usually quite complex organic substances — that can change their color when the pH of the environment changes. Although it is possible to determine the environment using indicators, they cannot show the exact value of the potential of hydrogen, so it is not uncommon for professionals and students to use digital pH meters that show a specific number.
Objectives
The purpose of this practical work is to investigate the acid-base titration method on the example of the interaction of ethanoic acid with sodium hydroxide. In the course of the work, the author solves such issues as the chemical titration procedure, the construction of a pH calibration plot, the construction of a titration curve (pH), the calculation of Ka, and the comparison of theoretical values with practical ones.
Calculations and Steps
Of primary importance is the chemical acid-base titration procedure to determine practical pH values. It should be specified that the whole titration process should be divided into three consecutive stages: before, during, and after the equivalence point. Thus, each of the stages has a unique formula for calculating the pH value. At the initial moment, even before adding the first drops of sodium hydroxide, the pH of the solution is determined only by dissociation of acetic acid:
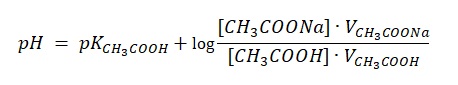
However, when sodium hydroxide is added to this solution, the interaction will result in an equivalent amount of acetate-ion, which, in a mixture with acetic acid, forms acetate buffer solution.
![]()
Therefore, the entire branch of the titration curve to the point of equivalence can be calculated utilising the formula used to calculate the pH of buffer solutions formed by weak acid and its highly soluble salt.
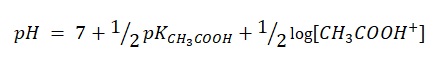
When enough amount of sodium hydroxide was added, the point of equivalence came. At this point, acetic acid fully reacted with sodium hydroxide, and in the solution, there were products of their interaction, namely salt and water. At this point, the pH equals:
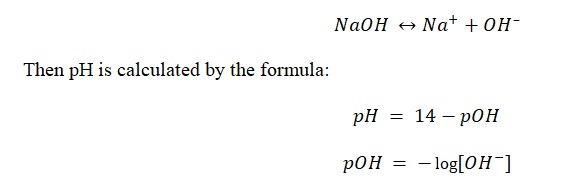
Starting from this stage, the concentration of OH ions increases in proportion to the added volume of alkali, which dissociates in the solution:
Subsequently, data on pH values are recorded in Table 3 (see Appendix A).
Calibration Plot
The secondary task is to build a calibration plot, based on which it will be possible to create a curve of acid-base titration. In order to determine the real pH values for the solution, it is necessary to correlate the potential of hydrogen values for the buffer mixture and the sample under analysis. The practical data showing the three measurements are given in Table 1.
Table 1. Information on three pH measurements for the buffer solution and the probe to be analyzed.
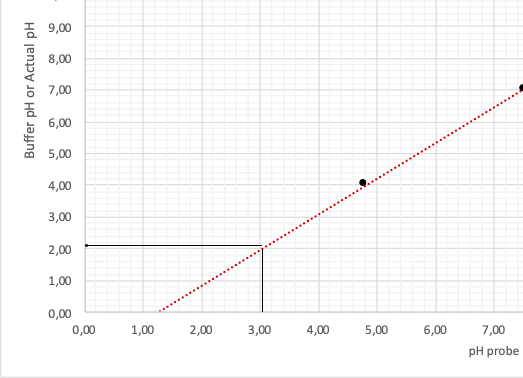
Utilizing these values, the author has drawn a calibration plot in coordinates Probe/Buffer. The points were connected by an extrapolation line extended for several periods forward and backward, as illustrated in Figure 1.
This graph allows determining real pH values obtained not from the calculations but during the experiment. For this purpose, it is necessary to define the point on the horizontal axis, which is fair for the theoretical pH values of the solution presented in the second column of Table 3 (see Appendix A). A detailed procedure for the correlation between the two pH values is shown in Fig. 2. Then, the actual pH values of the analyzed solution are listed in the third column of Table 3.
Creating a titration curve
Operating the first and third columns of Table 3, the author of this work plots the acid-base titration curve. In combination with setting the point of equivalence, this curve allows estimating the dynamics of changes in pH values depending on the volume of added sodium hydroxide to weak acetic acid. As presented in Figure 3, the hypothesis of the nonlinear growth of potential of hydrogen is confirmed.
Thus, when analyzing plot no. 3, it is possible to make two conclusions:
- the point of equivalence for this type of titration has approximate coordinates (25.40,8.2).
- near the end of the curve, the dynamics of pH values can be noticed, apparently due to the measurement error or undesirable chemical interactions in the solution.
Ka Calculation
In addition, using the titration curve, the acid dissociation constant (Ka) and base constant (Kb) can be determined. In this practical work, the author defined the Ka value for the point of equivalence calculated using the Henderson-Hasselbalch model:
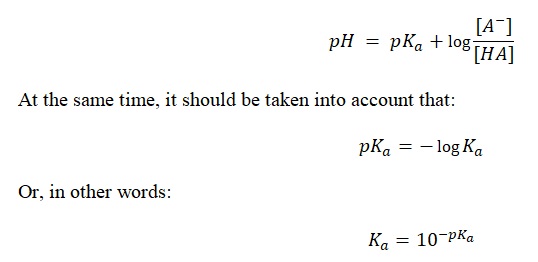
Moreover, it should be considered that the calculation of the acid dissociation constant should be done for the half equivalence point, since in the first area of the curve, up to the equivalence point, the pH values have not changed too intensively. Consequently, the calculation of Ka should be done for a point with the 25.40/2 coordinate. Since the acid and base concentrations are equal here, the logarithm is reset to zero:
Which means


Therefore, the acid dissociation constant is equal to:

Or alternatively:
Comparison With Reference Value
To estimate the error, the reference value of the constant dissociation characteristic of acetic acid should be used. According to the references, for weak acid CH3COOH, the value of Ka is equal to

. Then the measurement error should be determined by the formula:


Risk Assessment
Table 2. Five Step Risk Assessment on HSE.
Appendix A
Table 3. Five steps of risk assessment for HSE.