Summary
This report covers the financial analysis and business environment of Agthia Group. The company is publicly traded under common stock on Abu Dhabi Securities Exchange. It is among the food and beverage industry leaders. The current business environment is favorable for growth. The PESTLE analysis indicates a favorable political environment in the UAE, stronger economic growth, rising populations, disposable incomes, technology adoption, change in consumer consumption patterns, legal environments, and the desire to protect the environment.
Additionally, the financial ratios of the company for profitability, liquidity, solvency, operating efficiency, and stock market performance are also positive. Hence, potential investors should consider Agthia Group for investment. While the company is good for investment some economic developments, such as the rising costs of utilities and a slowdown in revenues could due to low oil prices have affected returns. Besides, major operations of the company are in the Middle East region, which constantly faces threats of terrorism and war. These factors have slow down the growth of the company and limit its strategic goals.
Introduction
This financial analysis report focuses on the Agthia Group. The two-part report covers issues related to the company in part one and presents a financial analysis report in part two. Some of the most recent economic turmoil and financial crises across the globe have demonstrated the need to have reliable information about firms for decision-making, particularly for investors, creditors, management, and other market participants. Using financial ratios, one can determine both the short-term and long-term viability of a business entity (Drake & Fabozzi 2012; Warren 2014). A careful selection of ratios is vital to ensure that information presented is useful for decision-making. The choice of these ratios is largely determined by the intended purpose of the information.
Part 1: Understanding the Company
About Agthia Group
Established in 2004, Agthia Group is the main food and beverage firm in Abu Dhabi (Agthia Group 2017). The company is publicly traded on the Abu Dhabi Securities Exchange with the ticker symbol, AGTHIA. Senate General Holding Corporation, which is an Abu Dhabi Government company, controls the majority shares (51%) while other retail and institutional investors, including Emirates International Investments LLC (5.57%) and the Abu Dhabi Retirement Pensions and Benefits Fund (NA) control the remaining percentage (Mubasher 2016).
Agthia Group has established its assets in the UAE, Egypt, Oman, and Turkey. The company provides an excellent portfolio of integrated businesses offering exceptional quality and trusted food and beverage brands for consumers and users across the wider Middle East, GCC, and Turkey. It boasts of more than 3,000 employees who handle various aspects of business management and operations, including product manufacturing, distribution, and marketing (Agthia Group 2016). Agthia Group deals in water, flour, animal feed, juices, and dairy using different subsidiaries. Additionally, the company recently ventured into frozen vegetables, tomato paste, fruit puree, and baked products.
According to the information contained in the company’s annual report 2015, the company performed well based on a year-over-year evaluation with double-digit revenue and profit growth (Agthia Group, 2015a; 2014a; 2013ba). These performances showed the company’s capability to drive its sustainable growth strategy through continuous improvement of its core businesses while focusing on other product development for diversification and massive regional presence. The company’s net sale was AED 1,866 million representing a growth of 13%, the net profit rose to AED 231 million (a 20% increment in the net profit) (Agthia Group 2016).
Major operations
Agthia Group subsidiaries include Al Ain Water, Al Bayan, Alpin Natural Spring Water for water products, Grand Mills for flour, Agrivita for animal feed, Al Ain Fresh, and Capri Sun specialize in juice, and Yoplait that offers dairy products. As previously observed, the company also introduced other products, including tomato paste, frozen vegetables, fruit puree, and baked goods (Agthia Group 2016). These companies mainly handle the manufacturing, distribution, and marketing of the above-mentioned products.
The company’s assets are spread in four countries, and the products are sourced in the UAE, Egypt, and Turkey.
Products and Services
Agthia is one of the leading food and beverage groups in UAE and ranked among the top ten of food and beverages in the Middle East. It operates in the food and beverage sector with a diversified chain of products in various segments, including flour; animal feed; bottled water; beverages; processed fruits and vegetables; dairy; and frozen baked products. It is important to recognize that the company has embarked on massive diversification to grow its brand in the Middle East region. More importantly, Agthia now focuses on international distribution across Europe, Africa, and the wider Middle East Region (Agthia Group 2015a). Overall, the company has 15 brands under seven food and beverage categories (Euroland 2016).
Major Competitors
The food and beverage industry in the Middle East is highly competitive because most companies from neighboring countries consider it an emerging lucrative market. While the industry is highly fragmented with small producers, there are well-established companies that perform better than Agthia Group. Almarai and Savola groups are Saudi Arabia companies that have dominated the food and beverage industry in the Middle East, according to Forbes Middle East ranking in 2016 (Maceda 2016). Additionally, the Americana Group of Kuwait, Oman Flour Mills, Al Kabeer, IFFCO Group of Companies, Al-Matahin (Bahrain Flour Mills Company), Al-Watania Poultry, and Solico Group with its root in Iran are also leaders in this industry. Overall, Agthia Group faces competition from both well-established and highly diversified companies, as well as from other small fragmented firms. Nonetheless, it is imperative to note that Agthia Group is among ten leading firms in the food and beverage industry in the Middle East.
Agthia Group in Stock Market
As mentioned above, the company is listed in the Abu Dhabi security exchange. The company trades in ordinary stock since its IPO in 2005. The analysis demonstrates that Agthia Group realized massive following its IPO. For instance, revenue has grown to AED 1.9 billion (4.3 times), while net profit has increased to AED 0.9 billion (7.9 times) (Euroland 2016). Additionally, total assets have reached AED 2.4 billion (2.9 times), market capitalization is now AED 4.6 billion (6.1 times), ROA 10.1% higher (2.7 times), ROE is now about 14.9% higher (3.5 times), and working capital to net sales is now 2.5% higher (0.5 times) (Euroland 2016).
The current share price is AED 6.35 with a traded volume of 16,876 and a turnover of 107,228.06 (Mubasher 2016). The lowest share price was AED 5.94 while the highest was AED 6.46 (Mubasher 2016). Notably, the company stock price is most likely to improve as it executes strategic goals, including expansion and acquisition. Further growth in revenue and profit will also lead to a higher share price.
Audit Report Analysis (Annual Report)
Agthia Group auditor is KPMG. The auditor concluded that the financial statement of the fiscal year 2015 was a fair representation of the fiscal position of Agthia Group in the financial year 2015, its performance, and consolidated cash flow based on the International Financial Reporting Standards (Agthia Group 2015b).
According to the audited report of the company, its financial performance has increased steadily. The company’s net sale was AED 1,866 million representing a growth of 13%, the net profit rose to AED 231 million (a 20% increment in the net profit) (Agthia Group 2015b). Additionally, strong performances were also demonstrated on return on assets, return on equity, and return on net capital employed. All these indicators grew by 1% relative to the fiscal year 2014.
Significant Events
In the fiscal year 2015, Agthia Group realized several important events related to capital expansion projects in the UAE and across other areas of operations (Agthia Group 2015a). The company installed additional production and warehousing infrastructures in available facilities. It also added new facilities following the acquisition of Al Bayan Water Company (Agthia Group, 2015a). Al Bayan Water is among the major five-gallon water firms in the UAE with a presence in Oman. The company also introduced new products and variants in different categories and improved packaging and artwork (Agthia Group 2017). Additionally, it installed a new high-speed bottling line, which was responsible for an increased capacity of over 40% to 74 million cases each year. This facility was scheduled for completion in April 2016. Still in the year 2015, Agthia Group revamped its capacity for animal feed production in the UAE and bottled water in Turkey (Agthia Group 2015a). The company also became the first Agri company in the UAE to attain the status of FSSG 22000 following the upgrade of the food management system of grand mills flour and animal feed facility. It also expanded the storage facility of the Al Ain warehouse to 32,000 pallets (Agthia Group, 2015). In 2012, it bought a new warehouse in Dubai to expand its storage and distribution capacity.
The company also made a significant acquisition in Turkey following the deal involving a Turkish water company. Between 2013 and 2016, the company has signed multiple distribution agreements with major companies in the region, including Monster, Al Foah, the Olayan Group in the KSA, and JV in Kuwait to produce Al Ain Water (Euroland 2016) (Agthia Group, 2014b; 2013a).
In 2017, the company also experienced a change of leadership following the resignation of Iqbal Hamzah. Tariq Ahmed Saeed Al Wahid was appointed as the acting CEO to provide leadership and execute the growth strategy to attain revenues of US$1 billion by 2020 (Agthia Group 2017).
Industry Demands
Demand status is described as attractive to players and investors (Chummee & Yimprasit 2014). This implies that the industry is thriving due to the noted high GDP per capita, increasing the labor force, and limited food production capacity of existing facilities (Chummee & Yimprasit 2014). Analysts conclude that healthy food and beverage categories and other premium food products have huge growth potential (Chummee & Yimprasit 2014). The UAE is considered the best starting point for investors who wish to penetrate the region. Leading companies tend to have the right product, local partners, and product positioning to excel in the region (Chummee & Yimprasit 2014).
The food and beverage sector in the region is as diversified as it is profitable. This sector witnesses shifting industry trends not only in the mature markets of Europe and the U.S., but also in emerging markets such as China, the Middle East, and India. Additionally, it is experiencing a marked change in consumption patterns, particularly driven by health awareness campaigns, rising incomes, and increasing demands because of the rising population. Consolidation, the emergence of developing nations coupled with their population growth, and increasing government regulations are influencing food manufacturing companies and their business strategies.
As the Food and Beverages industry grow rapidly, it puts manufacturers under pressure to keep up with the changing trends and the shift in consumer interests. Multiple factors are available to help industry leaders better evaluate and forecast upcoming trends to maximize their returns. First, the frequency of consumption of the product as the population of the UAE and the countries that Agthia exports are increasing.
This frequency shows a larger potential customer base demands more of non-alcoholic products, such as mineral water, milk, and juices. Agthia has been expanding its water business over the past two years through facility upgrades and multiple acquisitions. The segment, which includes the Al Ain and Al Bayan water brands, “continues to be a key driver of growth”, according to Tariq Al Wahedi, the acting chief executive officer of Agthia. Second, cultural demand is reflected in emerging trends. For instance, affluent consumers and busy professionals now opt for caned products and fast foot to save cost and time. These aspects of consumer behavior influence the growth and success of the industry.
Third, purchase intent shows how much consumer behavior has to change for consumers to experience the product and immediate benefits. However, purchase intent would not be difficult to attain because of rising cultural demands. Fourth, product innovation is also driving demands. Agthia Group has revamped existing products and introduced new lines of food and beverage products to create new markets and explore new opportunities. The company also uses both traditional and social media to drive its brand. Users of the company’s Web site can purchase products or share related information to others using different social media platforms, including Facebook, LinkedIn, and Twitter. Fifth, Agthia Group controls its supply chain and ensures fulfilling the local demand as they expand and promote new products. That shows that Agthia has the requisite infrastructure in place to meet the increasing demand. Finally, the company continuously invests in research and development (R&D) to develop new products and conducts thorough market research to determine demands.
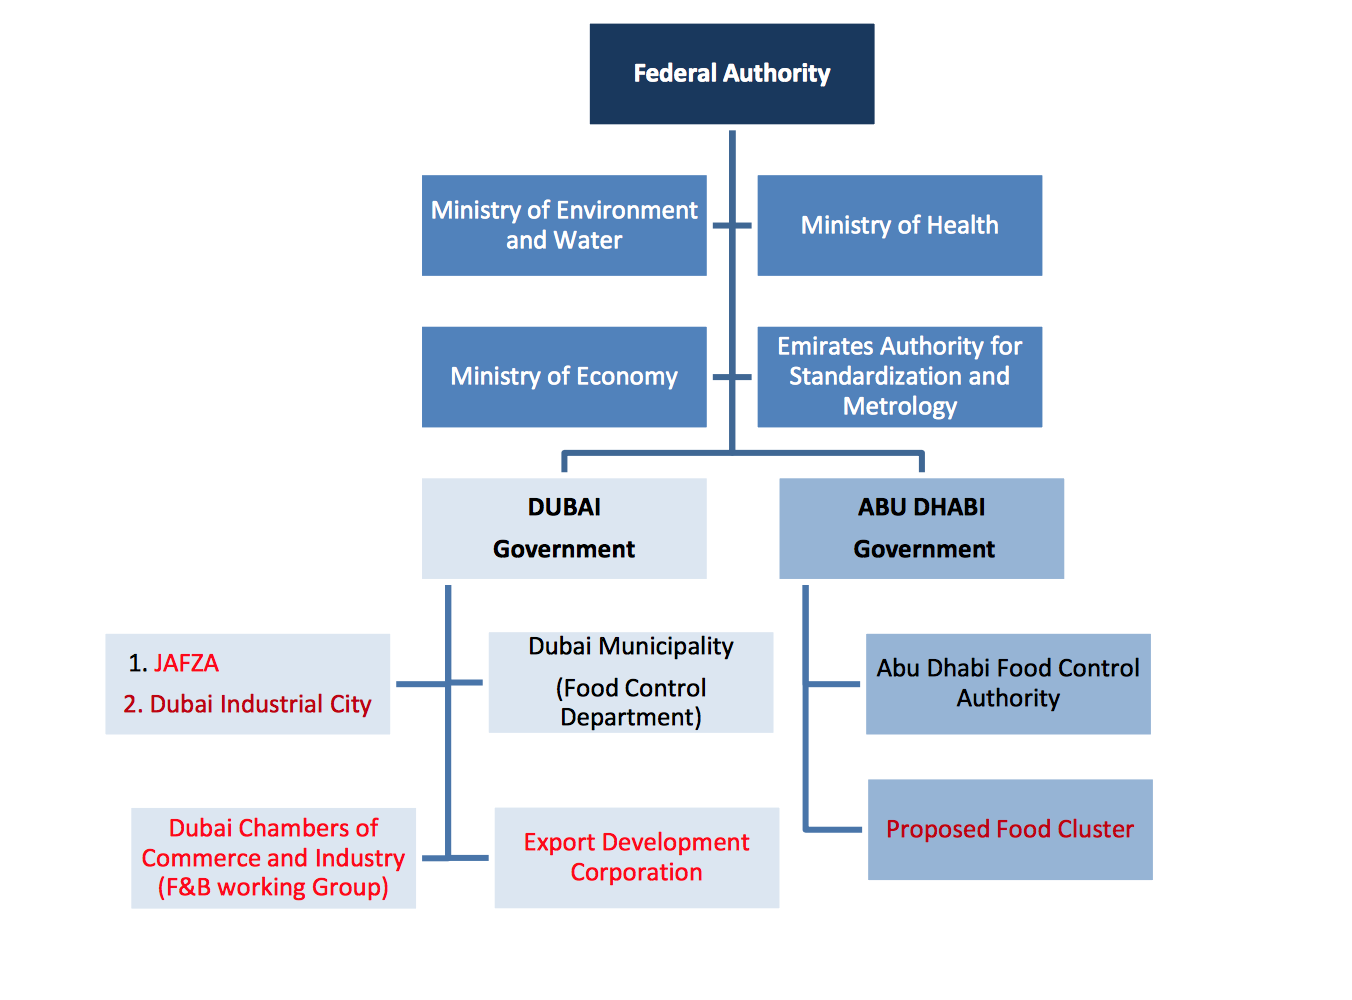
Industry laws and regulations also influence food and beverage industry practices. The UAE all manufacturing activities are regulated by the federal body – Ministry of Economy (see appendix). A distinct Federal and Emirate-level government organization plays a role in regulating the development and inspection and certification of some standards involving food Safety. The Emirates Authority for Standardization and Metrology (ESMA) role is to prepare, approve, publish, review, modify, issue, and adapt standards and technical regulations, as well as to determine the national measurement system in line with GCC standards (see appendix).
In Abu Dhabi, the responsibility of enforcing standards and inspections is under the Abu Dhabi Food Control Authority.
The Food and Drink Federation in the UK predicts a huge potential for future growth for the food and beverage industry. The growth might reach 20% by 2020 based on the forecast (Hughes 2016). As mentioned earlier, the Agthia group extended its exports to more than 20 countries and expanded its operation in four more countries (Sahoo 2017). In 2016, the Agthia group net profit increased by 10 percent from the previous year while net revenue grew 8%. Much of the revenue originated from the Group’s water business, as it is more demanded and now the core business of the company. This growth shows the resilience of the food and beverage industry to the economic turmoil.
In the Food and beverage industry, particularly halal and organic foods are among the growing segments in the GCC region, and it is expected to grow at the rate of 8.5% and reach $1.5 billion by 2018. With rising incomes in most Muslim countries, the global halal food and beverage market is expected to reach US$1.6 trillion by 2018. This is seen as a significant growth opportunity within the region. For example, in the UAE, the Jebel Ali Free Zone (JAFZA) is developing two cutting-edge Halal Zones, one for international markets and the other for the local and regional markets.
These Halal Zones will provide integrated services to streamline the halal supply chain. Moreover, Alpen Capital predicts a growing demand for organic food in the GCC (Alpen Capital 2015). According to Alpen Capital (2015), “the UAE, Agthia’s main market, has witnessed one of the fastest population growth rates in the world in recent years, given the influx of people from all over the world” (p. 4). Hence, the demand and growth rates are more likely to improve, as well as earnings for the company (Zawya 2016).
As consumers become more health-conscious, there is a greater demand for healthy foods. In emerging markets, including the GCC, there is an increased demand for low-fat dairy products and low-calorie foods, particularly in the GCC, which has higher-than-average rates of obesity and chronic diseases. As such, there is likely to be a greater demand in the future for healthy food and beverage products.
The sophistication of global and regional consumers today coupled with rising health awareness has led to noticeable changes in the types of processed foodstuffs that are in demand, putting pressure on producers to improve their product offerings. For instance, mixed flavored juice products are becoming more popular at the expense of traditional single flavored products, and consumers’ preference for juice products without additives is rising. Conventional water without functional additives makes up the largest segment of the bottled water market, and it is expected to reach $166.5 billion by 2018, while the market value for flavored and functional water is expected to reach $28.8 billion in 2018, a CAGR of 12% from 2013 to 2018. Further, bottled water consumption in the GCC will rise by 50% to more than 21 billion liters by 2020 – 98% is locally produced (Beer 2014). Globally, there is an increased demand from developing nations, such as China, Brazil, Russia, and India, and Asia is expected to consume half of the production by 2023.
In the GCC region, poultry is a growing sector (+12% CAGR 2010-2020) – 65% of the consumption is met through imports while increased demand for premium protein continues to rise (Alpen Capital 2015). Much focus is now on the demand for improved Halal standards.
The most recent report by Euromonitor International demonstrates that the “soft drinks market size in the Middle East and Africa is expected to cross 81.4 billion liters this year, of which, 1.9 billion in the UAE market” (Mounzer 2016, para. 3). As for the bottled water sector, the report shows that “the Middle East and Africa region’s market size will attain 50.5 billion liters in 2016, of which, the UAE’s market size will reach 1.2 billion liters” (Mounzer 2016, para. 3). Drinking water (60%) is the most consumed beverage in the GCC, followed by juice (20%), and soft drinks (17%).
The business environment in 2017 will remain difficult due to external forces driven by cost changes. The overall key drivers include health and wellness, safety, social impact, experience, and transparency (an overarching driver).
Influence Factors – PESTLE Analysis
Various factors, including technology, health awareness, and regulatory environments in the food and beverage industry have become critical influencing factors. One can understand these factors by applying business environment analytical tools, such as PESTLE analysis.
Political – although the UAE is relatively stable, other countries in the Middle East and Africa pose critical political challenges to the growth of the company due to insecurity, terrorism, and poor governance.
Economic – the per capita income is rising in the region. As such, consumers have more spending power, and they are most likely to improve consumption. Economic factors demonstrate a promising future for the industry. On the other hand, low oil prices and rising costs of utilities following the reduction or abolishment of energy subsidies have affected the economy negatively, leading to high costs of doing business and poor revenues (Maceda 2016; Arqaam Capital Limited, 2016). Agthia had predicted a slowdown in gains in the subsequent year 2017 (Sahoo 2016).
Social – emerging social practices, such as modern life consumerism, health, and wellness awareness campaigns, drive consumption of processed foodstuff across the globe, and the Middle East region is no exception (Deloitte Development LLC 2016).
Technological – technological factors have transformed food processing in the region. Agthia has installed some of the latest state-of-the-art equipment to boost production and meet recommended best industry standards.
Legal – consumers now require transparent processes. That is, food manufacturers must reveal the contents of their products. In this regard, they must meet food safety standards to avoid lawsuits.
Environment – water is now an important commodity in the Middle East and a core business for Agthia. The company must strive to reduce wastage, ensure efficient energy use, and protect the environment. Environmental protection will be critical for industry players in the future.
Part 2: Financial Statements Analysis and Understanding the Financial Statements
Brief about Financial Analysis
The financial analysis for Agthia Group covers the fiscal period 2013 to 2015 (Agthia Group 2013b). Ratio analysis involving liquidity, profitability, solvency, operating efficiency, and stock market performance is applied to determine the trend and understand the company performance year-over-year. These ratios will provide an insight into the company’s financial health, and detailed calculations for all the ratios are provided in the appendix.
Liquidity
Current Ratio
Source: (Morningstar, Inc. 2017; Fusion Media Limited 2017; GuruFocus.com, LLC 2017; Thomson Reuters 2017)
The current ratio for the last three years indicates that Agthia Group had a ratio beyond 1, and the company has a higher current ratio than the industry average. Therefore, Agthia can meet its short-term debts as they fall due on a particular date.
This ratio generally offers a quick method to assess the financial health of Agthia. Higher ratios are preferred because they demonstrate high chances of paying off debts. That is, Agthia has a good percentage of asset values compared to its total current liabilities.
Quick Ratio or Acid Test
Source: Source: (Morningstar, Inc. 2017; Fusion Media Limited 2017; GuruFocus.com, LLC 2017; Thomson Reuters 2017)
Agthia has also maintained quick ratios above 1 for the last three fiscal years, and it performs better than the industry average. Thus, Agthia can meet its short-term obligations when necessary. Ratios below 1 indicate poor liquidity.
Profitability
Gross Margin Ratio
Gross Profit Margin for the company has increased from 27% to 32% in the fiscal year 2015, while the industry average is 32.4%. This ratio has increased since 2013, showing that Agthia is at par with the industry average. Hence, it makes profits of about 27 to 32 from every AED invested.
Net Profit Margin
The net profit margin percentage has increased from 10.5 to 12.3% between the fiscal year 2013 and 2015, while the industry average is slightly lower (12.27%). Agthia still realizes profits, after all, operating expenses, costs, taxes, and any preferred stock dividends have been eliminated, and the percentage shows that Agthia changes its revenues into profits for shareholders.
Return on Investment
Return on Investment ratio shows an increasing trend from 8.15% to 9.7% between the fiscal period 2013 and 2014 compared to an industry average of 12.03% (2015). Thus, currently, Agthia is generating about 9.4% cents income from every AED it holds as assets.
Solvency
Debt/Equity Ratio
The debt to equity ratio shows the fraction of Agthia financing that originates from banks, creditors, and investors. A higher ratio generally shows that Agthia relies heavily on bank loans instead of investors to finance its expansion and other investments. Agthia debt to equity ratio has ranged between 0.5 and 0.6 over since 2013. This ratio shows that Agthia uses about 50% of external financing for its strategic business goals.
Time Interest Earned Ratio
Time Interest Earned Ratio (debt service ratio or fixed charges cover ratio or Interest coverage ratio) demonstrate the frequency of annual interest expenses are covered by income before interest and tax (net operating income) of Agthia Group. It is a long-term solvency ratio, which shows that Agthia Group can pay its interest charges when they fall due. In the fiscal years 2013, 2014, and 2015 Agthia Group had a positive interest expense ratio of 12.65, 10.59, and 12.78 respectively.
Operating Efficiency
Asset Turnover Ratio
Source: (Morningstar, Inc. 2017; Fusion Media Limited 2017)
The total asset turnover ratio demonstrates net sales as a percentage of assets to indicate how many sales are generated from every AED of Agthia assets. For this company, a ratio of 0.81 shows that every AED of assets produced 81 cents of sales for the company.
Inventory Turnover Ratio
Source: (Morningstar, Inc. 2017; Fusion Media Limited 2017)
This efficiency ratio indicates how effectively Agthia manages its inventory for a fiscal period. The company ratio showed an increase from 3.37 times to 4.7 times relative to the industry average of 4.8 times.
Stock Market Performance
Price Per Earning Ratio
(Morningstar, Inc. 2017; Fusion Media Limited 2017)
This market prospect ratio has increased from 13.46 in the fiscal year 2013 to 15.82 in the fiscal year 2015. It shows that investors are willing to pay AED 15.82 (this is the multiple at which the stock is currently trading). The ratio helps investors to determine the worth of a share-based on what they are ready to pay.
Conclusion and Recommendations
Based on the analysis of the company business environment and its financial performance for the fiscal years 2013, 2014, and 2015, it is concluded that Agthia Group is a relatively stable company operating in a growth-oriented environment, and it is supported by a strong financial performance. The company does not have negative ratios, and it is on par with the industry average ratios. Nonetheless, it must focus on risk management to protect earnings and predict potential failures (Fathi, Zarei & Esfahani 2012; Atrill & Hurley 2012; Bhandari & Iyer, 2013).
The decision to invest, therefore, is made based on the following observations. First, the company is poised for massive growth. Most reports covering the food and beverage industry in the Middle East have demonstrated that this industry will continue to grow steadily. Moreover, the company also understands how water consumption has increased and now significantly contributes to its revenues. Consequently, Agthia has invested heavily in water production and distribution, including the signing of distribution contracts. Second, the company is financially stable. As previously noted, Agthia Group does not have any negative ratios. Moreover, revenue, profit, and other margins have continued to grow year-over-year for the fiscal periods analyzed.
As the company expands its operations to other countries, it is expected to earn more revenues and profits for shareholders. Third, PESTLE analysis indicates that population growth, the rise in disposable incomes, the focus on environmental conservation, technology-driven approaches, and efforts to manufacture products that adhere to halal standards are most likely to support growth in the GCC region. For better returns on stock, a growth-oriented investor should use a buy-and-hold approach for a long-term period to gain higher earnings once the company’s share price has appreciated (Abramov, Radygin & Chernova 2015).
However, it is also noted that the low oil prices and rising utility costs are major economic developments that have affected the company negatively. These developments have led to increments in operation costs and a slowdown in revenue generation. Additionally, Agthia major markets are found in the Middle East. However, this region is prone to terrorist attacks and wars. The act of lawlessness in some regions has negatively affected the growth of the company. Thus, any potential investor needs to understand how changes in economic activities, government decisions, and other factors influence stock markets and companies’ overall performance.
Reference List
Abramov, A, Radygin, A & Chernova, M 2015, ‘Long-term portfolio investments: New insight into return and risk’, Russian Journal of Economics, vol. 1, no. 3, pp. 273–293. Web.
Agthia Group 2013a, Annual report 2013, Agthia Group, Abu Dhabi, UAE.
Agthia Group 2013b, Consolidated financial statements for the year ended 31 December 2013, Agthia Group, Abu Dhabi, UAE.
Agthia Group 2014a, Agthia Group PJSC: Report and consolidated financial statements for the year ended 31 December 2014, Agthia Group, Abu Dhabi, UAE.
Agthia Group 2014b, Annual report 2014, Agthia Group, Abu Dhabi, UAE.
Agthia Group 2015a, Annual report 2015, Agthia Group, Abu Dhabi, UAE.
Agthia Group 2015b, Consolidated financial statements for the year ended 31 December 2015, Agthia Group, Abu Dhabi, UAE.
Agthia Group 2017, About Agthia,
Alpen Capital 2015, GCC Food Industry, Web.
Arqaam Capital Limited 2016, UAE – Consumer staples, Arqaam Capital Limited, Abu Dhabi, UAE.
Atrill, P & Hurley, P 2012, Financial Management for Decision Makers, Second Canadian Edition, Pearson Canada Inc, Canada.
Beer, E 2014, GCC bottled water market to rise 50% by 2020, Web.
Bhandari, SB & Iyer, R 2013, ‘Predicting business failure using cash flow statement based measures’, Managerial Finance, vol. 39, no.7, pp. 667-676.
Chummy, C & Yimprasit, D 2014, The Middle East – a thriving market with great opportunities for the food and beverage industry, Web.
Deloitte Development LLC 2016, Capitalizing on the shifting consumer food value equation, Deloitte Development LLC, London, UK.
Drake, P & Fabozzi, J 2012, Analysis of Financial Statements, 3rd edn, John Wiley & Sons, New York, NY.
Euroland 2016 Agthia Group PJSC. Web.
Fathi, S, Zarei, F & Esfahani, SS 2012, ‘Studying the Role of Financial Risk Management on Return on Equity’, International Journal of Business and Management, vol. 7, no. 9, pp. 215-221. Web.
Fusion Media Limited 2017, Agthia Group (AGTH): Financial ratios. Web.
GuruFocus.com, LLC 2017, AGTHIA- ADX (United Arab Emirates).
Hughes, N 2016, Feeding the growth of the food and beverage industry, Web.
Maceda, C 2016, ‘Top 100 companies in Arab world revealed’, Gulf News. Web.
Morningstar, Inc 2017, Agthia Group PJSC AGTHIA. Web.
Mounzer, S 2016, ‘UAE’s beverage industry is set for a booming 2016’, Asia Today. Web.
Mubasher 2016, Agthia Group PJSC (AGTHIA).Web.
Sahoo, S 2016, ‘Agthia forecasts slowdown in gains through year’, The National. Web.
Sahoo, S 2017, ‘Al Ain water maker Agthia posts 4% rise in fourth-quarter profit’, The National. Web.
Thomson Reuters 2017, Agthia Group PJSC (AGTH.AD) (Abu Dhabi Securities Market), Web.
Warren, CS 2014, Survey of Accounting, 7th edn, South-Western College Publishers, Stamford, CT.
Zawya 2016, UAE’s Beverage Industry is Set for a Booming 2016. Web.
Appendix
Liquidity
Current Ratio = Total Current Assets / Total Current Liabilities
Quick Ratio or Acid Test = (Total Current Assets – Inventories) / Total Current Assets
Profitability
Gross Margin Ratio = Gross Profit / Revenue
Net Profit Margin = Net Income / Revenue
Return on Investment = Net Profit / Total Assets
Solvency
Debt/Equity Ratio = Total Liabilities / Total Equity
Time Interest Earned Ratio = Income Before Interest and Taxes or EBIT / Interest Expenses
Operating Efficiency
Asset Turnover Ratio = Net Sales / Average Total Assets (two fiscal years)
Inventory Turnover Ratio = Cost of Goods Sold / Average Inventory
Stock Market Performance
Price Per Earning Ratio