Introduction
It is important to implement various graphs and diagrams to understand the operation of the existing businesses and ensure the new company’s success (Kumar, 2022). The main goals of operations management are to ensure that the company can make the provision of products and services more efficient and increase customer satisfaction (Kumar, 2022). The example of Target allowed us to see both operations from diverse perspectives and find the strong and weak sides of the business.
Systems Diagram
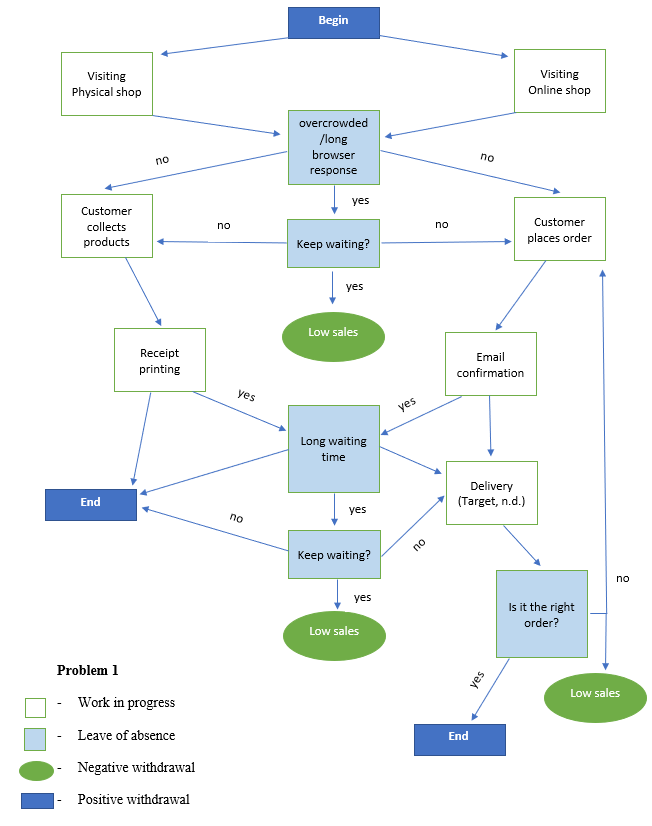
Figure 1 below presents Target’s operation and shows the processes happening online and in physical stores. The graph allowed us to see the detailed purchasing process and catch issues at every stage to apply relevant and quick solutions. All problems may cause a decrease in sales, and it is important to maintain stability in operations to avoid financial crises. This practical problem helped me learn the process control system and implement it in individual business plans.

Flow Chart
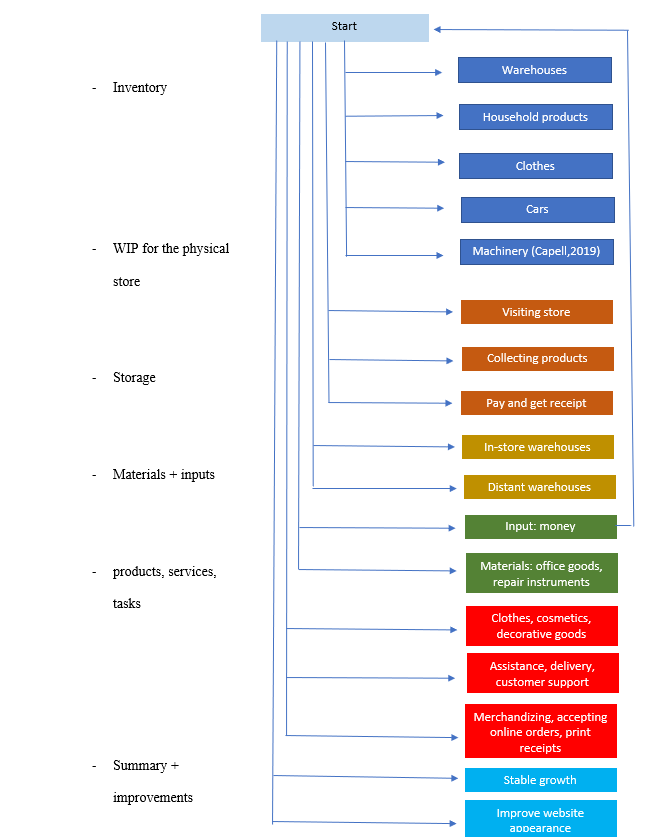
The flow chart of Target allowed us to understand the invisible inventory used in the processes. Figure 2 shows the full documentation of the materials used in product and service delivery. After the analyses regarding the storage material and tasks of workers, some improvements can be made. For example, some website appearance and functionality issues were detected, and improvement can help increase the business’s performance.

Fishbone Diagram
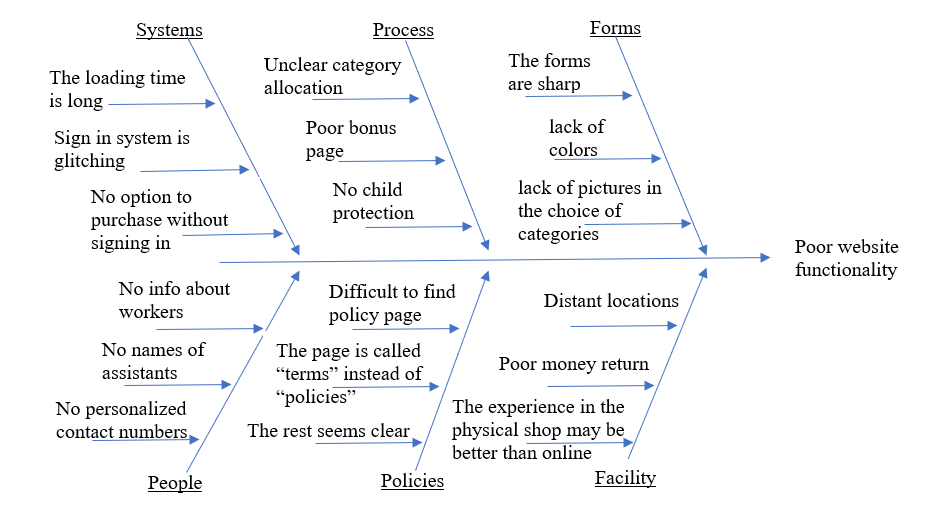
Some problems were identified by implementing the fishbone diagram related to Target’s operations. The structure of the fishbone diagram helps to dive deeper into the issues of the business and apply working solutions in the future (Coccia, 2018). The right locations of the current issues on the diagram support prioritizing solutions, as some problems should be solved first to maintain progressive operations inside the company. Figure 3 below shows Target’s fishbone diagram, which proposes the main concern of poor website functionality.

Systems Audit
Even though Target is one of the most successful companies in the United States, managers continue implementing new services that increase customers’ loyalty and generate more profit. In the OM practical problem four, the concept of a well-designed service system was used to make services more appealing to clients and affordable for the business. Moreover, the idea of the service system showed that structured implementation of new services makes it easier to spread responsibilities among workers (A Bullseye View, n.d d.). Therefore, deep analyses of Target’s operations teach us to make clear plans for all projects.
Summary and Statement of Learning
The service and product delivery of Target allowed to analyze the operations management from different perspectives and learn new analyzing techniques for further business studies. This ePortfolio showed a clear structure of a real-world case related to one of the greatest businesses in the US. The fishbone diagram, flow chart, and system diagram helped to find successful business problems and generate possible solutions. As a student, I learned to implement diverse concepts into studies and find both positive aspects that support operations and negative sides that should be improved.
Conclusion
In conclusion, it is important to make operational management analyses for different types of businesses to see threats and opportunities that are ruining processes or may affect the future. When logistics, marketing, management, and manufacturing are combined in one idea, it becomes easier to see the whole company picture and produce developmental plans. Therefore, using graphs and diagrams should be addressed while producing evaluation documents.
References
A Bullseye View (n. d.). Products & Services. Web.
Coccia, M. (2018). The fishbone diagram to identify, systematize and analyze the sources of general-purpose technologies. Journal of Social and Administrative Sciences, 4(4), 291-303. Web.
Kumar, R. R. (2022). Operations Management. Jyothis Publishers.