Anova Definition
Analysis of variance is a statistical tool performed to outline whether the means of two or more different techniques differ in terms of their approach (Singh, 2018)
Today’s overwhelming number of techniques applicable to data analysis makes it extremely difficult to define the most beneficial approach while considering all the significant variables. For example, when talking about healthcare, various treatment patterns are to be meticulously analyzed on the topic of the prerequisites that might potentially contribute to the final treatment outcome (Singh, 2018). To consider all the possible factors that influence the results of a certain procedure, the analysis of variance, or ANOVA, was introduced. One of the major goals of the following analysis is to decide whether seemingly different approaches to the same issue have nothing in common when it comes to the means of these techniques’ performance.
Conditions for the Anova Application
When it comes to the framework’s application to the suggested areas, it is important to take into account some conditions that are to be fulfilled when analyzing the methodology. Since ANOVA is primarily focused on the variances that might be potentially significant for the procedure outcome, all the nuances of the methodology application are to be presented for the result precision and efficiency. Moreover, the overall number of methods has to be higher than two, as the comparison of the two techniques does not require such a sophisticated approach and night be performed through the T-test scheme.
Anova Assumptions
Since the ANOVA statistical analysis presupposes meticulous research on independent populations, it is of crucial importance for the basic assumptions of the method to be met within the empirical data provided by the aforementioned groups. Among the assumptions outlined, the significance of common variances within the groups could not be overestimated due to its role as a comparison basis creator. Another important aspect to consider is the normality of distribution in the context of the analysis conduction. However, it goes without saying that even once all the assumptions are taken into account when setting up the analysis, the analysis minimal measurement error will be present (“Assumptions of the factorial ANOVA,” n.d.). One of the most efficient ways to minimize the error is to secure a higher variation within the sample.
Anova Result Interpretation
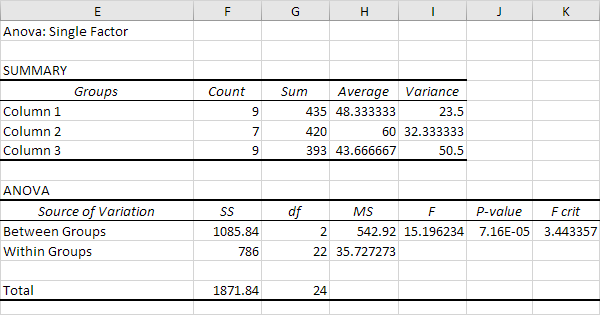
When it comes to the ANOVA result interpretation, it is necessary to bear in mind that one of the final goals of the process is to define the qualitative difference between the means while processing their variances. Hence, while some of the major steps of interpretation cover the processes of data configuration and defining whether it corresponds with the chosen model, the most crucial part of the ANOVA is the process of comparing the analysis outcome with the assumptions made at the initial stages. In order to secure the proper execution of each operation, MS Excel should be used during the analysis, as it already contains the build-in formulas to calculate the variance meanings.
Excel as a Statistical Software for Anova Analysis

References
Assumptions of the factorial ANOVA. (n.d.). Web.
Interpret the key results of the one-way ANOVA. (2019). Web.
Kim, T. K. (2017). Understanding one-way ANOVA using conceptual figures. Korean journal of anesthesiology, 70(1), 22.
Singh, G. (2018). A simple introduction to ANOVA (with applications in Excel). Web.
Zaiontz, C. (2020). Assumptions for ANOVA. Web.