The process of estimating a population parameter, unknown and fixed, from a sample statistic, known and random, is called statistical estimation. This process involves forming either a point estimate or an interval estimate. The former is a single numeric value, often referred to as the “best guess” at estimating the value of the corresponding population parameter.
Discussion
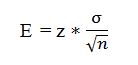
In contrast, the latter is a range of plausible values that estimate population parameters and is given as a point estimate ± margin of error. The margin of error, E, is a value by which a point estimate, within an interval estimate, might deviate from the real population value (Loftus, 2022). To minimize the margin of error, one should choose a reasonably large sample size to reflect the population parameter accurately. The margin of error is given by
The z-score tells where a point estimate lies on a normal distribution curve; σ is the sample standard deviation, the amount of variation from the mean for a single sample; n is the sample size. The quotient of σ and n is called standard error,.
A confidence interval is a range of estimates corresponding to the true population parameter with a specified degree of confidence. Confidence limits are the values at the lower and upper ends of a q-percent confidence interval, while confidence coefficient is the number of standard deviations on either side of the sample mean within this q-percent confidence interval. In other words,
Confidence interval = Point estimate ± Confidence coefficient * Standard Error.
For example, a random sample of 250 households surveyed in a large city found that 170 of them own at least one pet. Using these concepts, one can estimate the 95% confidence interval for a population parameter, such as the percentage of households in the city who own at least one pet. The process is as follows:
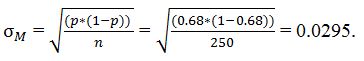
The point estimate, p, is the sample proportion: 170/250 = 0.68.
The standard error:
The confidence coefficient is the z-score for the 97.5th percentile, or 1.96.
The margin of error: E = k* = 1.96 * 0.0295 = 0.0578, or 5.78%.
The interval estimate is between p ± E, or 0.68-0.0578 = 0.62 and 0.68+0.0578 = 0.74.
Conclusion
Thus, percentage-wise, the 95% confidence interval for the specified population parameter is between 62% and 74%.
Reference
Loftus, S. C. (2021). Basic Statistics with R: Reaching Decisions with Data. Academic Press.
StudyCorgi. (2023, October 1). Aspects of Statistical Estimation. https://studycorgi.com/aspects-of-statistical-estimation/
Work Cited
"Aspects of Statistical Estimation." StudyCorgi, 1 Oct. 2023, studycorgi.com/aspects-of-statistical-estimation/.
* Hyperlink the URL after pasting it to your document
References
StudyCorgi. (2023) 'Aspects of Statistical Estimation'. 1 October.
1. StudyCorgi. "Aspects of Statistical Estimation." October 1, 2023. https://studycorgi.com/aspects-of-statistical-estimation/.
Bibliography
StudyCorgi. "Aspects of Statistical Estimation." October 1, 2023. https://studycorgi.com/aspects-of-statistical-estimation/.
References
StudyCorgi. 2023. "Aspects of Statistical Estimation." October 1, 2023. https://studycorgi.com/aspects-of-statistical-estimation/.
This paper, “Aspects of Statistical Estimation”, was written and voluntary submitted to our free essay database by a straight-A student. Please ensure you properly reference the paper if you're using it to write your assignment.
Before publication, the StudyCorgi editorial team proofread and checked the paper to make sure it meets the highest standards in terms of grammar, punctuation, style, fact accuracy, copyright issues, and inclusive language. Last updated: .
If you are the author of this paper and no longer wish to have it published on StudyCorgi, request the removal. Please use the “Donate your paper” form to submit an essay.
 .
.