Introduction
The practical value of statistical analysis lies in the ability to make data-driven decisions that reduce the effects of bias and subjectivity of conclusions. In this paper, statistical analysis is used to analyze differences in child mortality data between two regions. Since the data do not fulfill the criteria of normal distribution, the nonparametric Wilcoxon Rank-Sum test, similar to the parametric classical test (McClenaghan, 2022), must be used instead of the typical t-test of Independent Samples.
The results of the IBM SPSS test will determine whether there are significant differences in the mean child mortality rates between the two types of regions, namely underdeveloped and developed. Thus, the practical value of this paper is to determine the differences in the data under study and interpret the results to make further decisions to help reduce child mortality rates.
Results of the Analysis
Wilcoxon Rank-Sum test is used to test the significance of differences in mean values between two independent groups. The difference from the classical Independent Samples t-test is that the distributions of variables in the case of Wilcoxon Rank-Sum do not have to satisfy the conditions of normality (LS, 2021). On the other hand, the essence of the Wilcoxon Rank-Sum test is that the ranks of values between two samples are compared to determine the statistical significance of the differences between them. In other words, instead of directly influencing values, Wilcoxon Rank-Sum works with the ranks in the combined sample.
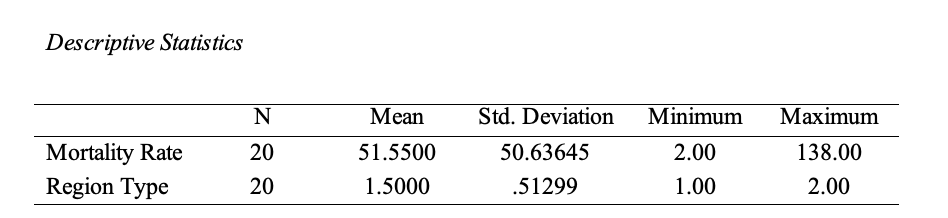
The test was produced in IBM SPSS under the name Mann-Whitney Test, as this name is the second name for the Wilcoxon Rank-Sum test. A total of twenty records were collected, ten for each of the two regions. Table 1 shows the results of the descriptive statistics for each of the two variables. From this, it can be seen that the mean child mortality rate is 51.55 (SD = 50.64). In terms of cohort statistics, the mean child mortality rate for underdeveloped regions is 17.40 (SD = 36.14), and for developed regions, it is 85.70 (SD= 38.92). Despite the apparent differences in the mean, descriptive statistics are not sufficient to test the significance of such differences.
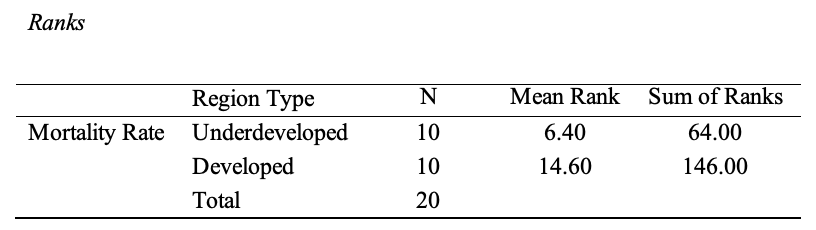
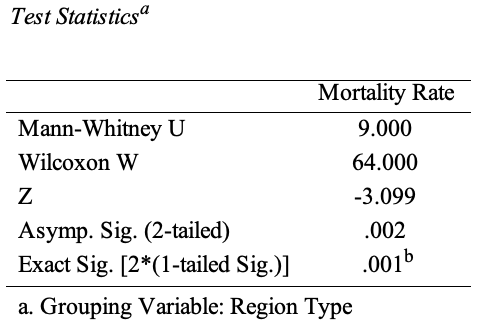
Unlike the values themselves, Wilcoxon Rank-Sum operates on their ranks, so the previously calculated mean values of child mortality for the two regions may not be of practical value. Table 2 summarizes the rank information for both categories of regions. Based on this information, developed regions have, on average, higher child mortality than underdeveloped regions. The obtained finding is characterized by statistical significance (U = 9.000, p =.002), as shown in Table 3, which means developed regions are indeed characterized by higher child mortality compared to underdeveloped areas.
Conclusion
This study aimed to perform a statistical analysis to detect the significance of differences in child mortality rates between underdeveloped and developed regions. The results showed unexpected results at first glance: developed regions reported higher child mortality rates on average than underdeveloped regions. One reason for this finding may be the greater propensity of developed areas to officially record and report such data, which may be different for underdeveloped regions.
References
LS. (2021). Mann-Whitney U test using SPSS statistics. Statistics Laerd. Web.
McClenaghan, E. (2022). Mann-Whitney U test: Assumptions and example. TN Informatics. Web.