Study Background
The problem of clustering a large data set is critical when the collected information is distributed at many levels, contains many records, and cannot be summarized reliably using descriptive statistics tools alone. The value of the clustering method is that it allows a large data set to be divided into distinct groups (clusters) with as similar characteristics as possible within the group but differ at the cluster level. In other words, clustering is used to identify which cohorts are present in the dataset, and hence, it has goals that lie in the plane of classification tasks. This approach also has the advantage of categorizing a particular region into a cluster, hence determining how the targets of interest for that region behave.
This study utilized data collected by the US Census (2023) for 2019, which included various demographic, social, and economic population data. The objective was to examine the data pertaining to accredited investors, identify their regions of residence, and conduct statistics on income and benefits.
Data Filtration
First of all, it is worth paying attention to the clustering method used, which was chosen to filter the data. The source file contained records for 282 unique ZIP codes specific to Connecticut. However, not every region was selected for the final cluster, but only those whose median annual household income was above $250,000 — this category of households was referred to as accredited investors for the purposes of this paper. After filtering by household income, the accredited investor’s cluster included only 13 records; their geographic location is shown on the map in Figure 1. Table 1 contains information on the ZIP code and corresponding household income for each element of the cluster created.
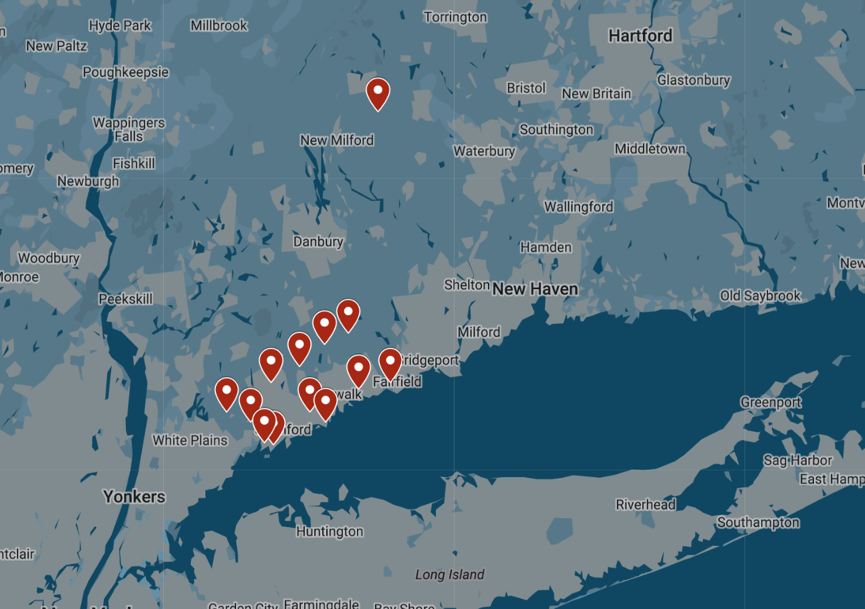
Table 1— Elements included in the cluster created.
Data Clustering
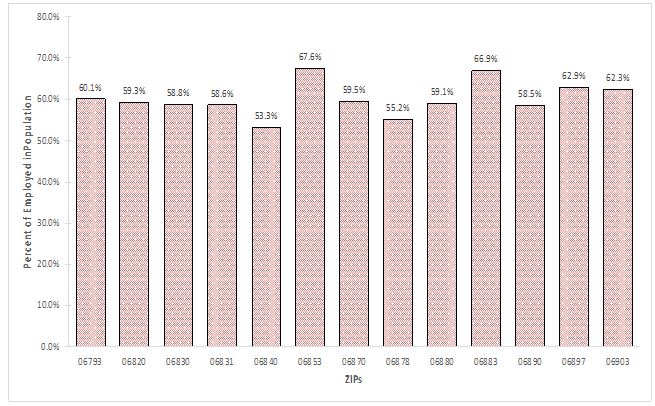
An additional interest was to study the structure of the elements in the cluster. Figure 2 shows the distribution of such shares: as the data shows, the top 4 regions were 06903 (62.3%), 06897 (62.9%), 06883 (66.9%), and 06853 (67.6%) — these regions had the most people (from the cluster) employed. Meanwhile, Regions 06840 (53.3%) and 06878 (55.2%) had the least population employed; however, this was still above half of the region’s population.
Data Analysis
Table 2 shows the percentage structure for each of the ZIPs, showing the proportion of family and non-family households, as well as retirement income cells, of the total employed population. Several conclusions can be drawn from the data. For example, the region with the highest share of households with retirement benefits is 06840 (15.0%), and the region with the lowest share is 06883 (9.7%). In addition, of all the cluster regions, 06840 had the maximum proportion of family households (67.3%), and 06793 had the minimum proportion of such households (44.1%). In terms of non-family households, 06883 had the minimum proportion (10.0%), and in contrast, 06793 had the maximum proportion of non-family units (30.7%).
Table 2 — Percentage structure of cluster elements.
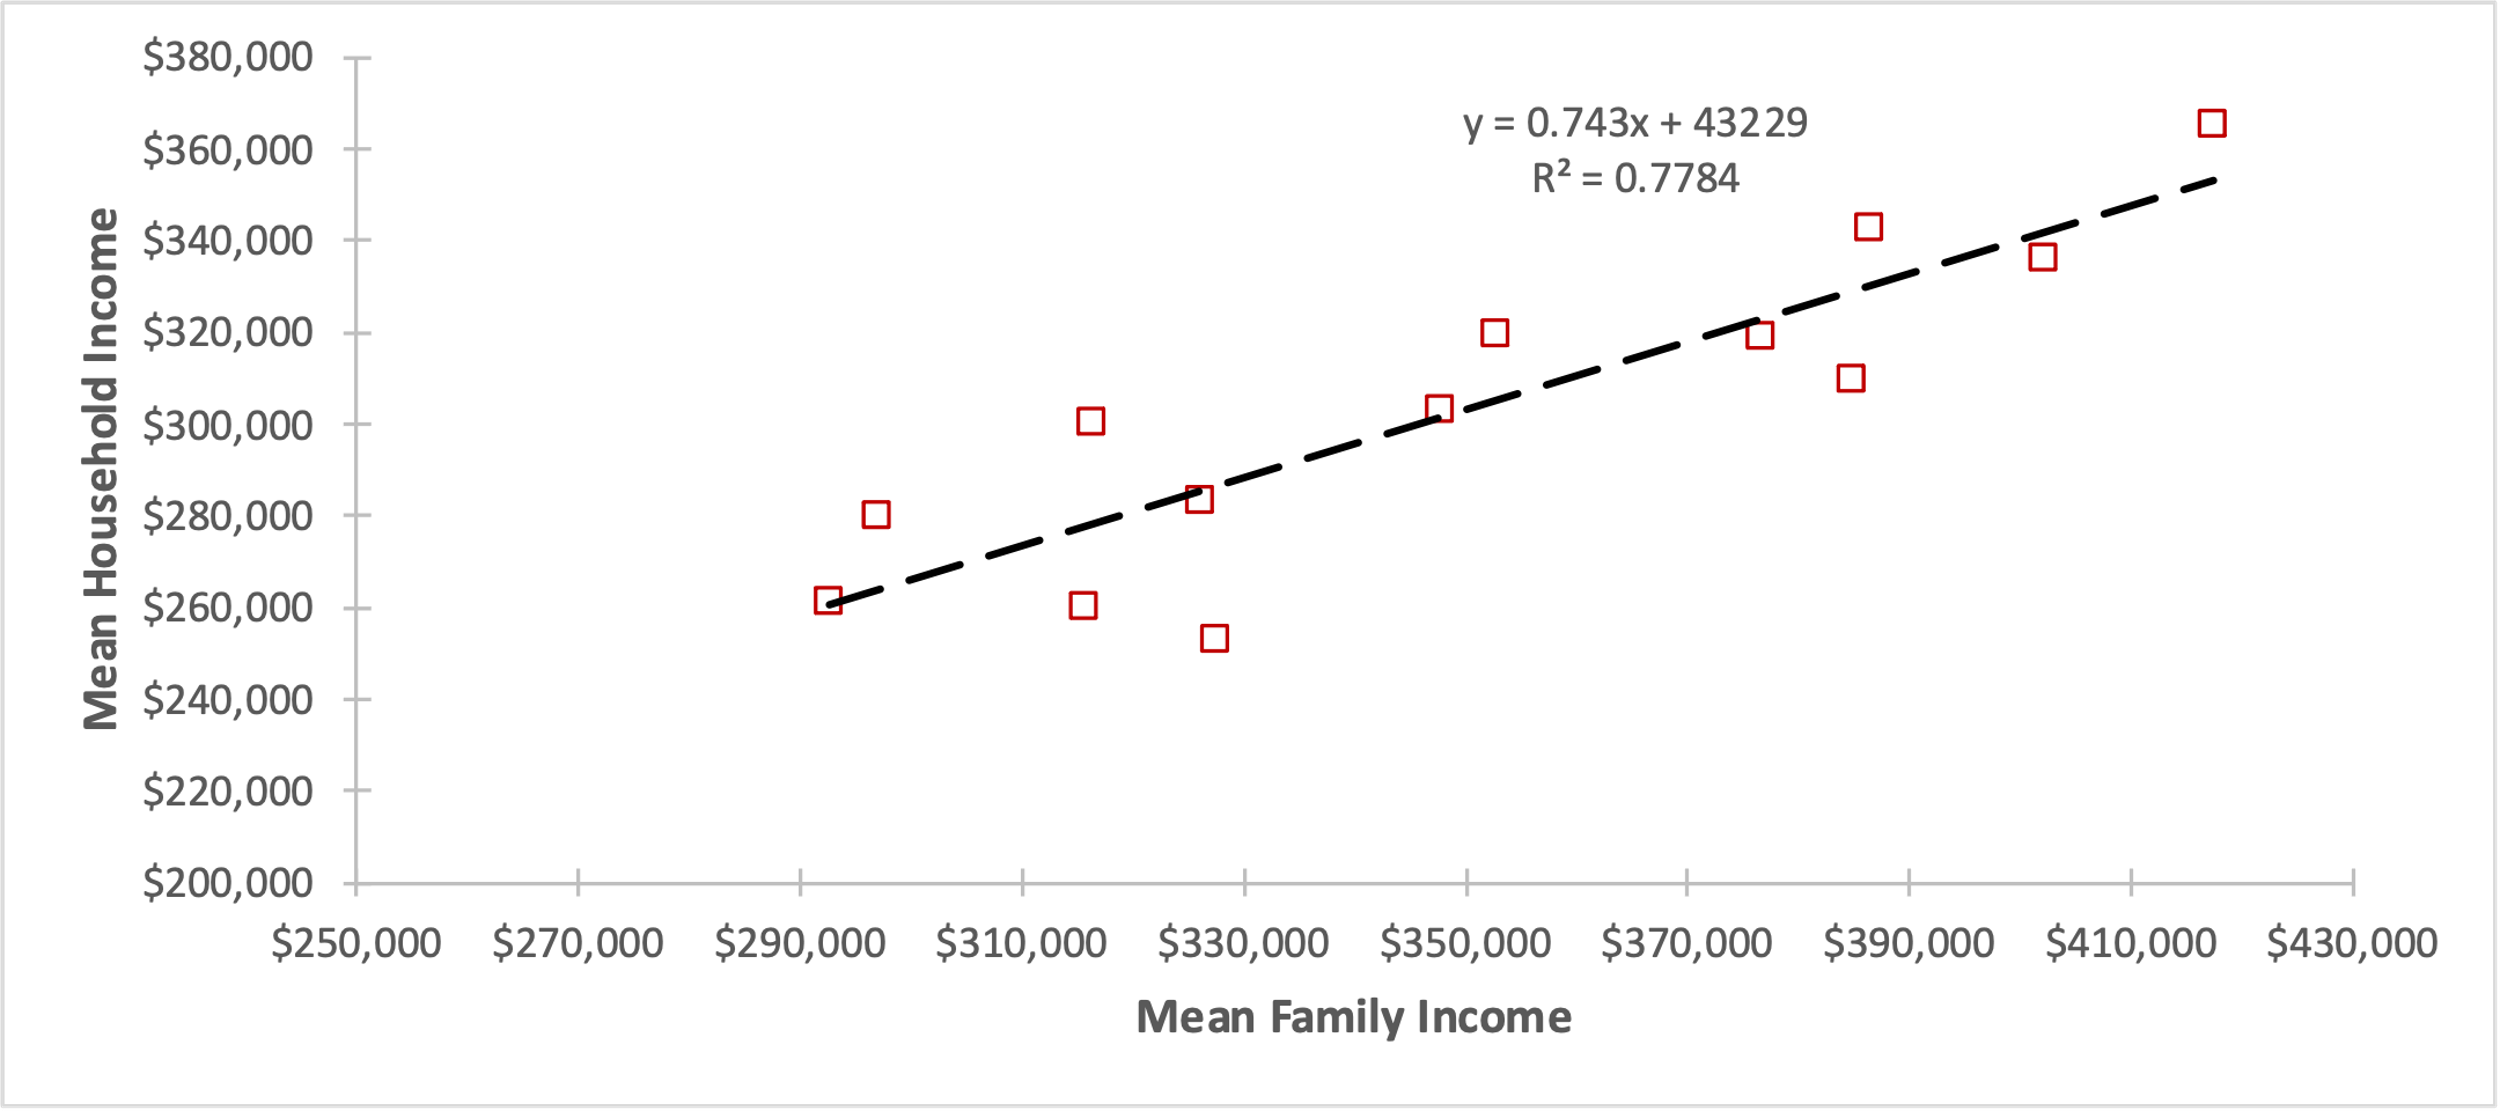
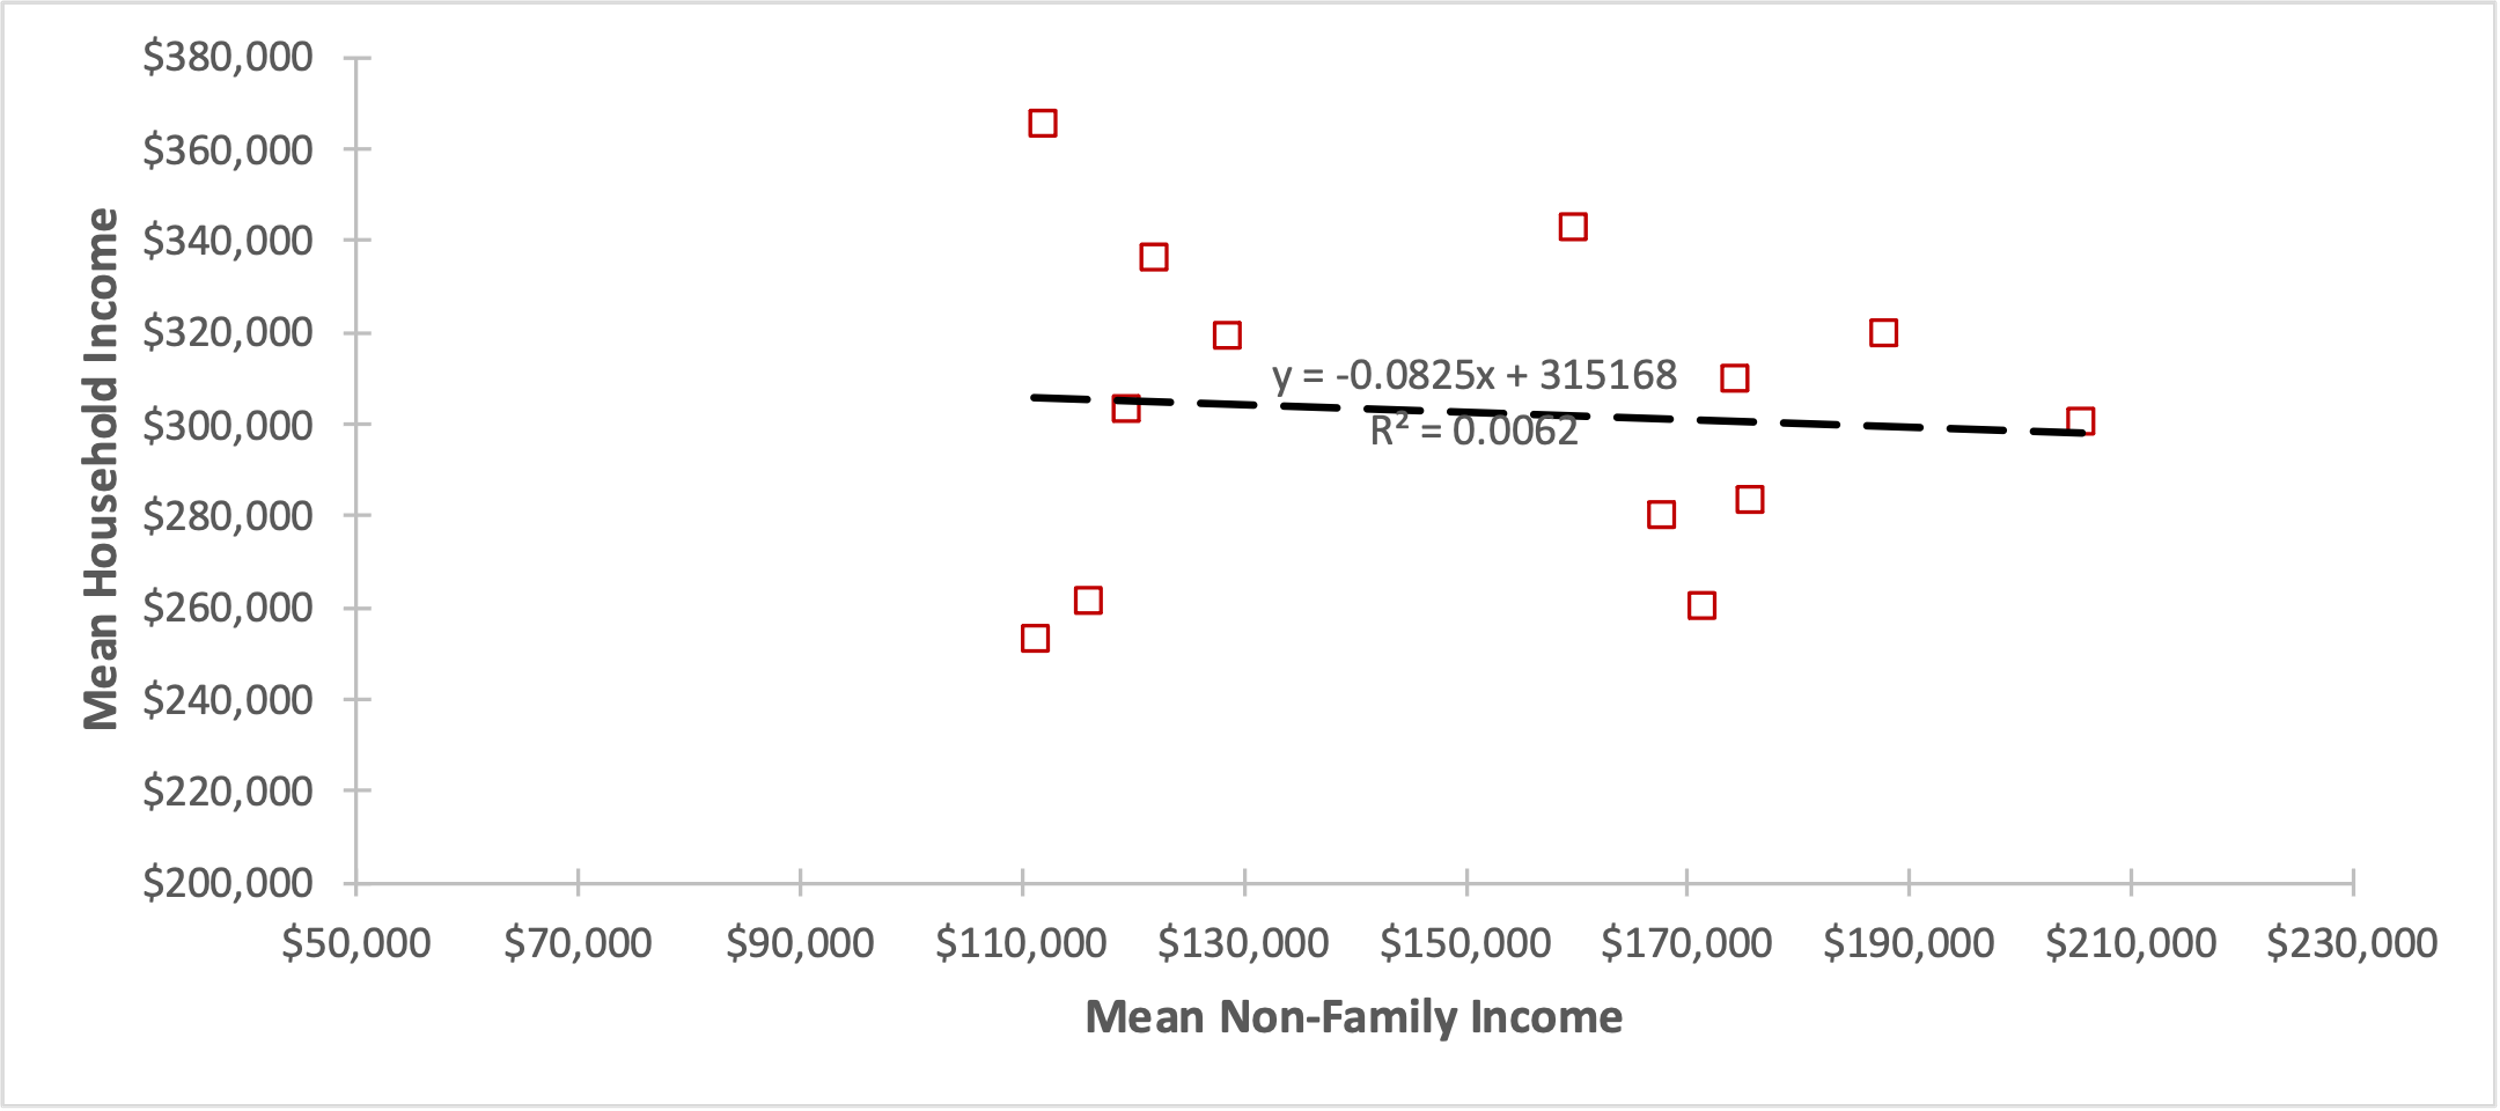
Following the findings, it was of interest to identify the relationship between family and non-family household income with total accredited investor income. As shown in Figure 3, an increase in family income leads to an increase in investor income. In contrast, the relationship between non-family household income and accredited investor income seems to be either non-existent (R2 = 0.006) or top-down for the cluster.
Findings
From the clustering results and data analysis, it was obtained that it was most appropriate for accredited investors to select regions from a cluster of 13 values to build a brick-and-mortar office. A more detailed cluster analysis showed that the income of investors will increase with the growth of family household income. Of all 13 regions in the cluster, only 06820, 06840, 06870, and 06878 had elevated rates of family households among the employed population. In other words, building a brick-and-mortar office in any of these four regions is a viable strategy for accredited investors.
Reference
US Census. (2023). DPO3: Selected economic characteristics. United States Census Bureau. Web.