Introduction
The primary aim of commercial enterprises is to maximize profits. However, organizations and companies around the globe are becoming increasingly conscious that they do not operate in silos and play essential roles in society and the environment (Ellis-Hall, 2020). It has led to the rise of corporate social responsibility, whereby companies try to integrate their business objectives with societal and environmental concerns in planning and execution, and they share this information through corresponding reports.
CSR reporting constantly evolves and varies across companies and regions (ICL Blog, 2022). CSR has become an indispensable part of business reporting in the last two decades, as evident from the fact that $20 billion was spent by Fortune 500 on CSR in 2018, and investments, which are considered socially responsible, amounted to over $30 trillion (GSIA, 2022; KS19, 2021). Therefore, these reports have become outlets for companies to showcase their actions and impact on various dimensions, including economic, environmental, and humanitarian agendas.
These reports help businesses incorporate their positive image into the identity of their brands. According to a recent Reputation Institute analysis that was featured in Forbes magazine, perception of a company’s CSR initiatives accounts for 42% of how people feel about its actions (Ellis-Hall, 2020). This shows the importance of the perception of the activities done by companies to support their communities and environment in the eyes of the public. CSR reporting encompasses the largely voluntary communications made by companies towards environmental, Social, and Governance-related matters (Fifka, 2013; Hahn, 2013; Huang, 2015). Furthermore, an important point to note is that CSR and sustainability are sometimes used interchangeably, but the former has a broader scope and is more normative than the latter.
Thus, conducting a statistical analysis by selecting the best method for analyzing the data and highlighting patterns is the main aim of this study. Despite numerous studies, there is a significant lack of information on the correlation of report properties (Fifka, 2013). For this reason, it is not consistently possible to adequately identify the main influencing factors to develop methods to influence them further. Thus, additional examination, designed to help identify correlations between different indicators and the number of reports, is done through textual data analysis.
Evolution of CSR from the 1950s Until Today
The concept of CSR was many decades ago and has evolved with the changing business and societal landscape. As per Kuhn (1991), CSR usually comes from trade unions. Bowen, an American economist, is often cited as the “Father of CSR” (Rahman, 2011). He connected the responsibility of organizations to society and published a book in 1953 called Social Responsibilities of the Businessman (ACCP, 2022). He provides a preliminary definition: “It refers to the obligations of businessmen to pursue those policies, to make those decisions, or to follow those lines of action which are desirable in terms of the objectives and values of our society” (Rahman, 2011, p. 167). Therefore, this concept appeared early in the previous century.
The CSR definition enlarged its scope in the 1960s when Keith Davis, another notable personality, made his statement on the issue. He argued that “businessmen’s decisions and actions are taken for reasons at least partially beyond the firm’s direct economic or technical interest” (Davis, 1960, p. 70). The 1970s saw further expansion in the scope of CSR. “Only one social responsibility of business – to use its resources and engage in activities designed to increase its profits so long as it stays within the rules of the game, which is to say, engages in open and free competition without deception fraud” (Friedman, 1970, p. 178). It is another of the most substantial definitions provided by the famous economist and Noble Prize winner Milton Friedman.
The 1980s further contributed to two dimensions of CSR. Freeman (1984) brought in the stakeholder theory, which encompassed the role of different groups, including customers, competitors, suppliers, media, and government, in implementing CSR effectively. The second was highlighted by Cochran and Wood regarding the relationship between CSR and profitability (Freeman, 1984). It was decided that CSR initiatives build up the reputation of companies, which translates to higher confidence in the products and services and results in higher revenues and profits.
During the 1990s, Hopkins (1998) said that the stakeholders also included entities both within, like employees or community support, and outside the firm. It was likewise during this time that the concept of the triple bottom line – People, Profit, and Planet – was put forward (Elkington, 1997). After that, the world shook up at the dawn of the 21st century because of the Enron collapse. It surprised the entire corporate space, as more stringent and transparent policies were demanded from companies. CSR reporting became compulsory in many countries, and companies also started voluntarily disclosing information to their stakeholders.
Shafiqur Rahman (2011), in his paper Evaluation of Definitions: Ten Dimensions of Corporate Social Responsibility, summarises the evolution of CSR definitions in 10 dimensions:
- Obligation to the society;
- Stakeholders’ involvement;
- Improving the quality of life;
- Economic development;
- Ethical business practice;
- Law-abiding;
- Voluntariness;
- Human rights;
- Protection of the environment;
- Transparency & accountability.
Recent Challenges to CSR Reporting
CSR has become an important part of companies’ reporting throughout the world. However, this has also led to organizations showcasing the ‘environmental’ side even when they are not fulfilling or meeting their commitments. Greenwashing is unsubstantiated claims by companies of their products or services that pretend to the consumers to be environmentally friendly or have a positive impact when it is not the case (Hayes, 2022). Many companies from diverse sectors, including Fashion, Tech, and Consumer Goods, have recently come under the scanner.
A lot of widely known brands appear on that list. Fast fashion brand Zara is criticized for its high carbon footprint in its supply chain and for not disclosing factors audits (Igini, 2022). Swedish retailer H&M is also being called out for its Conscious Collection products, which aim to use less water to manufacture but use more (Wicker, 2022). Tech companies are also pointed out for the same. For instance, though Apple has a webpage dedicated to its sustainability efforts, the difficulty and the high cost of repairs of its products make it not eco-friendly (Kingsley-Hughes, 2021). According to Tarantola (2021), food companies, including Coca-Cola and Nestle, have likewise come under scrutiny due to their use of plastic bottles despite their many efforts at sustainability.
Thus, consumers, stakeholders, and regulators must be aware and conscious, go deep into claims made by the companies, and then make an informed decision. With more and more companies reporting their sustainability efforts, it is crucial to comprehend the value of these reports to grasp the intentions behind the reports – whom they are targeting and what they are trying to accomplish. This thesis aims to examine the influence of institutional factors such as government regulation and stakeholders’ or shareholders’ expectations on non-financial reporting by analyzing the connections between the mutual field characteristics of such reports.
Research Questions
Based on the literature review on the issue, there is a particular knowledge gap about the relationship between the various factors. To investigate the main topic of the paper, it is necessary to understand the reasons and determine the actual degree of influence of regulation and stakeholders on the quantity, quality, and content of the reports. This process involves dividing the main research question into sub-themes, each focusing on an individual factor. The definitive and major question will be to determine the relationships between the factors to determine whether dependency exists. Thus, there will be tangible benefits to the sustainability scientific community and literature because of the dearth of such studies.
CSR and Sustainability Reporting encompasses many facets, including social, governmental, and environmental concerns. In September 2015, more than 190 world leaders agreed to 17 Global Goals for Sustainable Development (United Nations, 2022). These are called the Sustainable Development Goals, or SDGs, and represent “a universal call to action to end poverty, protect the planet, and ensure that by 2030, all people enjoy peace and prosperity” (United Nations, 2022). Once the analysis from dictionaries is done, we will see how they overlap with different SDGs across industries.
- What are the companies reporting, and how have their reports evolved over the years?
- How do non-financial reports, especially CSRs, vary across industries?
- How do such CSRs and their quantities vary across geographical locations?
- What is the connection between different CSR and SDG factors, and how exactly do they interact?
- What correlation could be noticed among the general goals, government and stakeholders’ regulation of industries, and the study results?
Methodology
To determine what the reports are about, we shall use text mining and topic modeling to do the analysis. The data set used was taken from Lindgren et al. (2021) materials and consists of 12980 text files, which are named based on the company name and publication year. First, the text file names and the years were separated, and afterward, everything was merged with the ‘gri_all_text_files.rda’ file. In this way, we have gained an overall perspective to start working with our dataset in a better and more efficient way.
Data Exploration
To understand the overall dataset, we plot a few graphs concerning the number of reports across publication years, sectors, company size, and regions, which are shown hereunder:
We observe that CSR reporting has become higher since 2010 and was relatively low before that period (Fig. 1). One possible reason for this is the Financial Crisis of 2008, wherein a major global meltdown of economies and job cuts were seen. Some studies also show a clear impact on the initiatives of CSR undertaken by companies during the crisis (Jacob, 2012). Those initiatives aimed to ensure organizational survival and community involvement.
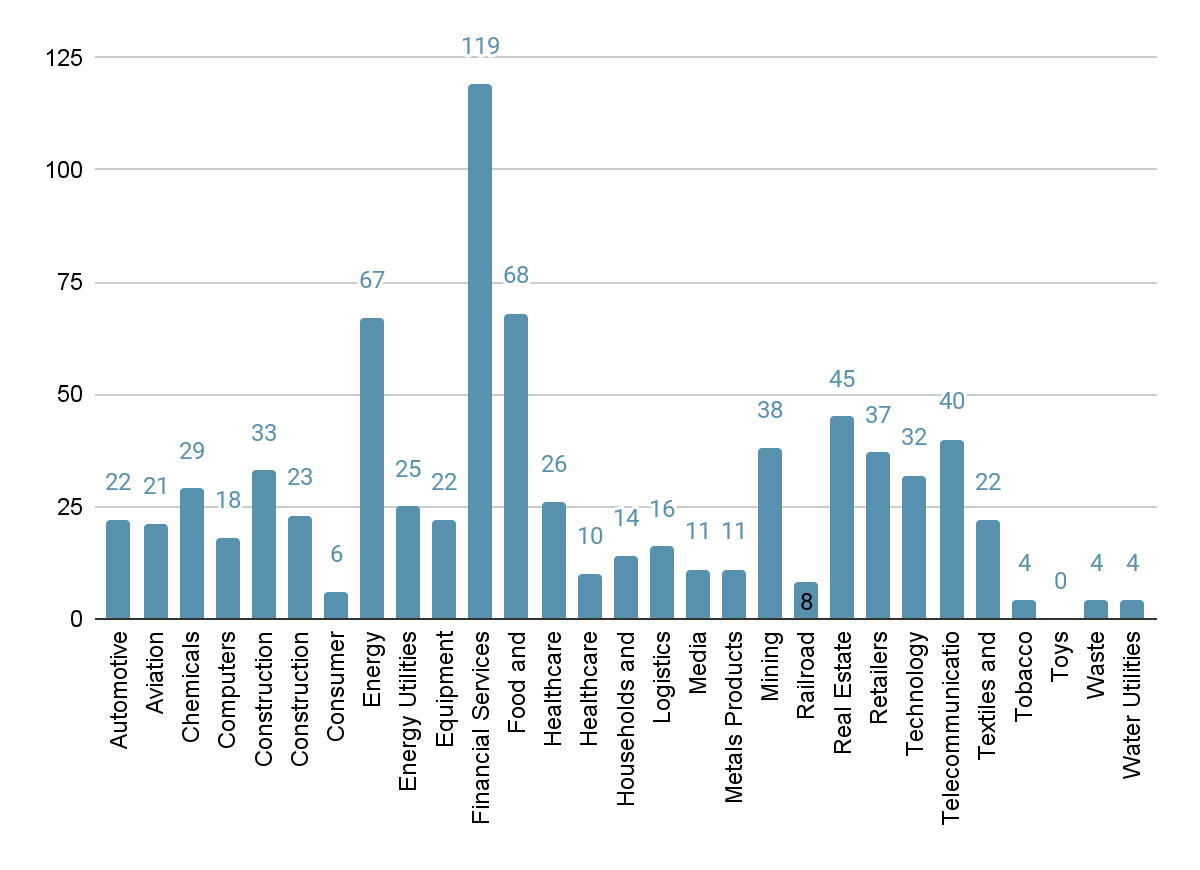
Regarding the sectors from which the reports are obtained, we get Financial Services, Energy, Energy Utilities, Food and Beverage Products, and Real Estate as the top companies. In line with the above discussion of the Financial Crisis, we see that the maximum filings have happened in the Financial Services sector (Fig. 2). Moreover, we also see industries including Energy, Energy Utilities, and Real Estate showing up among the top. Regarding size, large companies have the most filings (Table 1). This, to an extent, is understandable as large companies have more responsibility to report on CSR initiatives. The percentage distribution of the size is given below, along with that of regions. It can be seen that Europe has the greatest number of filings, followed by Asia and Latin America.
Table 1. Distribution of reports (in percentages) across company sizes and regions
Text Analysis Process
The analysis starts with rehearsing and adjusting it on a sample size of ~200 text files. This balanced sample dataset was chosen to replicate the entire population and make the initial process faster. This selection has a similar proportion of the size of companies: 120 Large (~60%), 66 MNE (~34%), and 14 SME (~6%) reports. To make sense of the CSR reports, we use the corresponding dictionary developed by Pencle and Mălăescu (2016), which helps to ascertain the topics that the reports mention.
The Business dictionary has four topics with a set of keywords, viz. Employee (318 keywords), Environment (451 keywords), Human Rights (296 keywords), and Social and Community (361 keywords). The above topic keywords are likewise taken from the article What’s in the Words? by Pencle and Mălăescu (2016). For simplicity, the overlaps among the topic keywords are ignored while performing the analysis.
For each record, the cumulative frequency of each topic is ascertained along with the total number of words. After that, the frequency of topic words is divided by the total frequency of words in that particular file. Thus, it will be able to provide us with the outcome in the form of four topics distributed across one file.
The process is further repeated for the remaining files. Thereafter, we analyze the allocation based on different types of industries and company sizes. Subsequently, it is possible to observe the final distribution, which can be repeated for another selection or a total sample. However, before proceeding to the results section, a few concepts and terms relevant to the methodology adopted in the research should be briefly explained.
Natural Language Processing (NLP)
Nature language processing is a relatively precise method of analyzing textual information, which finds its place in this study because of its ability to analyze such data on a large scale while remaining accurate and objective. The first step in NLP is the pre-processing of data. The raw data is processed to remove errors and irreverent text that could later impact the results generated.
Topic Modelling
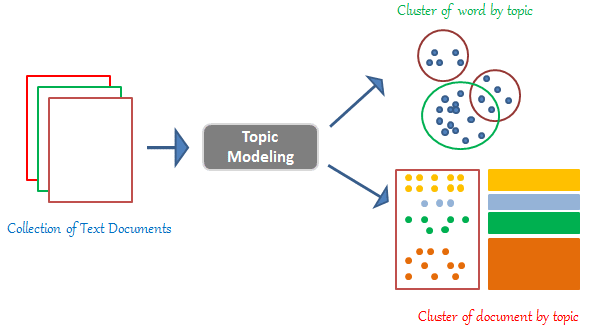
Topic modeling, in this case, is the process of identifying and discovering topics or themes in a series of documents (called text corpus) and tagging those documents with the discovered topics. In other words, it is the statistical process of extracting topics from a large set of documents. Figure 3 contains an illustration for an easier understanding of the issue:
There are different ways to implement topic modeling, such as Latent Semantic Analysis (LSA), Probabilistic Latent Semantic Analysis (LSA), Latent Dirichlet Allocation (LDA), and Deep Learning based lda2vec (Naskar, 2021). For our purposes, we shall focus on LDA.
Tokenization
In this process, the text in documents is divided into smaller units called tokens. The way it is done is that the long paragraphs are broken into sentences and then into words. These words (tokens) then become the unit for text analysis. Some different libraries and methods can be used to execute tokenization, namely NLTK Keras, Gensin, etc. For our analysis, we have considered the NLTK library in Python.
Stop Words Removal
Extra attention must be paid to potential interferences to further enhance the accuracy of the data processing. Certain words like articles, prepositions, conjunctions, and pronouns are parts of written language text. However, they seldom contribute to meaningful analysis and, hence, must be removed before processing the data (Khanna, 2021). The method of filtering such redundant pieces of material is implemented both for sample analysis and initial vocabulary analysis.
Stemming and Lemmatisation
Once the text is converted to tokens, the next step involves the normalization of the text. This is done through Stemming and Lemmatisation. Many languages, including English, have words that are derived from one another. For instance, the word ‘historical’ is derived from ‘history’. Another example would be ‘finally’ from the word ‘final’. The derived words are called inflected words, and the ones that are derived from them can be called root words (Saumyab271, 2022).
With Stemming and Lemmatisation, the inflected words are truncated to their stem or root words. One crucial difference to note is that in stemming, the reduced word may not be meaningful after the last few characters are removed from the word (e.g., ‘history’ and ‘historical’ would become ‘history’). To overcome this limitation, Lemmatisation is used, which produces meaningful language words that can be further used in text processing.
Results
As mentioned earlier, to explore the data, a sample size of ~200 files was initially created. To analyze the distribution of topics across various factors, including their frequencies, sectors, size, and years, we chose a boxplot as the graphical medium. The reason for selecting a boxplot is that it can handle large sets of data effectively. It provides a synopsis of the dataset with a five-number summary, viz. minimum, first quartile, median, third quartile, and maximum (Selvin, 2019). The following are the boxplots obtained from the analysis of the sample data.
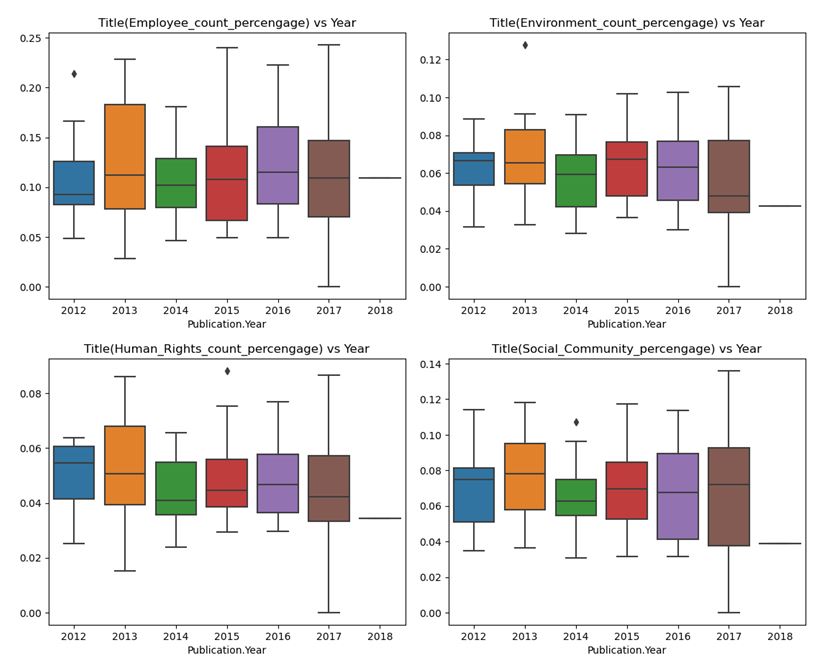
Topic Frequency Counts Across Years
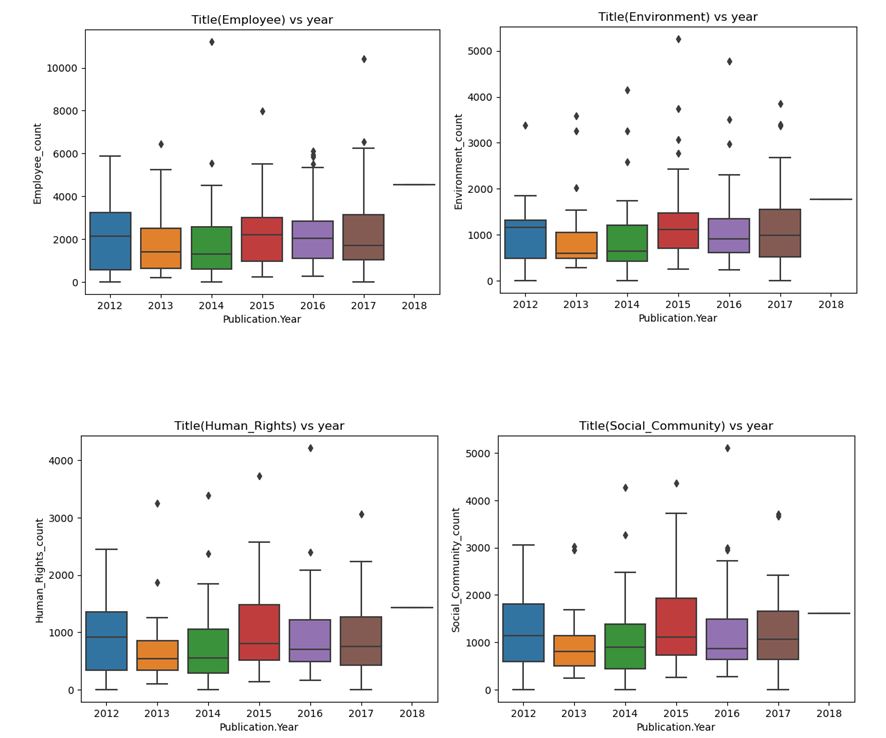
The median value of the Employee Topic has decreased since 2012. The Inter quartile range – IQR – has also shrunk over the years. We also see a similar trend in the second topic, the environment. The next two topics, Human Rights and Social Community, share the trend with median values peaking in 2012 and then stabilizing in the last three years (Fig. 4). We also plot Topics’ frequency in percentages across years from the below charts:
Topics Across Regions
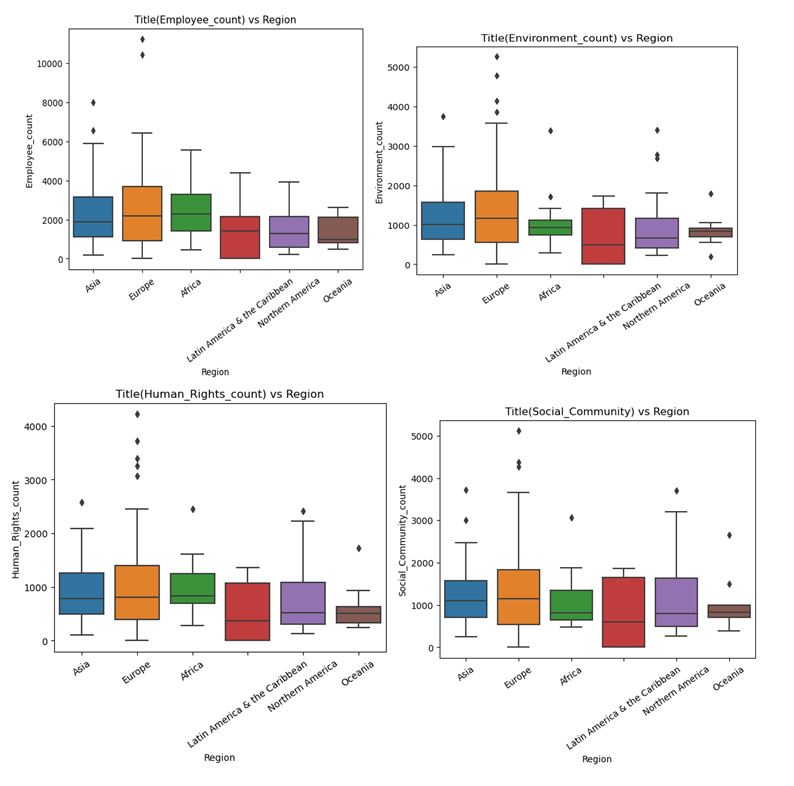
As we observed in the regional distribution of total reports filed, Europe sees healthy reporting across the topics with median values among the top two, whereas Oceania has the least. The size of the European and Oceanian regions can explain this; consequently, the number of companies is remarkably different. A fascinating observation is that the Latin American region may not have the highest median but has a sizeable IQR region.
Topics Across Sectors
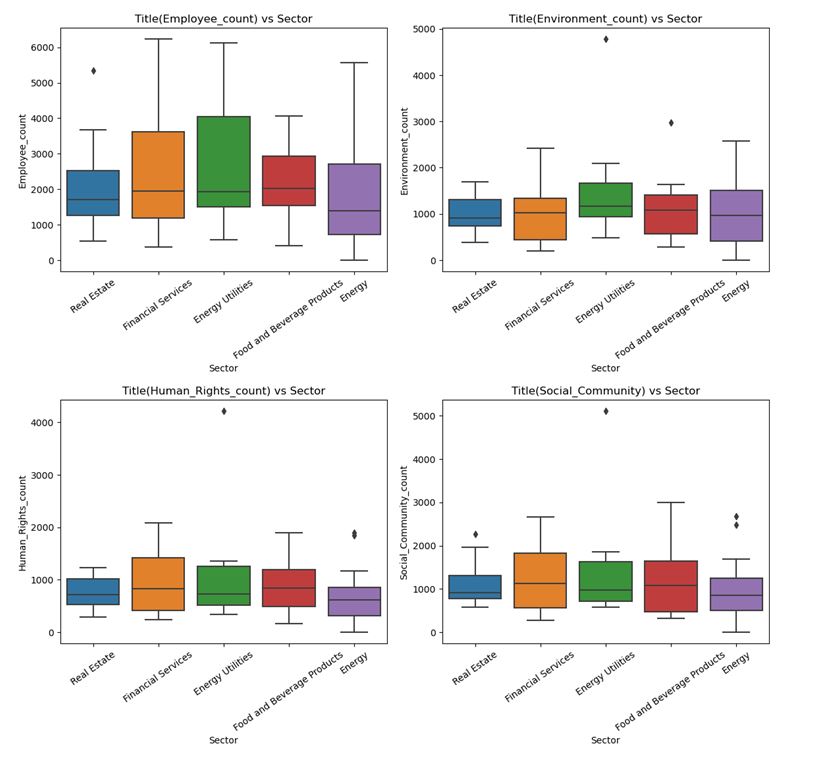
To know how the topics are distributed across industries, we select the top 5 sectors with the greatest number of reports. The Food and Beverage industry has the highest Employee Topic median value, whereas it is the least in the Energy sector. We also see a sizeable IQR for Financial Services and Energy Utilities.
For the Environment, Energy Utilities have the highest median value which is understandable as the sector usually comes under vigilance towards emissions-related matters. The Real Estate sector sees the minimum among the five sectors chosen for analysis. In the area of Human Rights as well as Social Community, we identify similar trends in the sense that both Financial Services and Food and Beverage have higher median values, with the former having a bigger IQR. We also observed a low level of deviation among the five sectors concerning the median values.
Topics Across Company Sizes
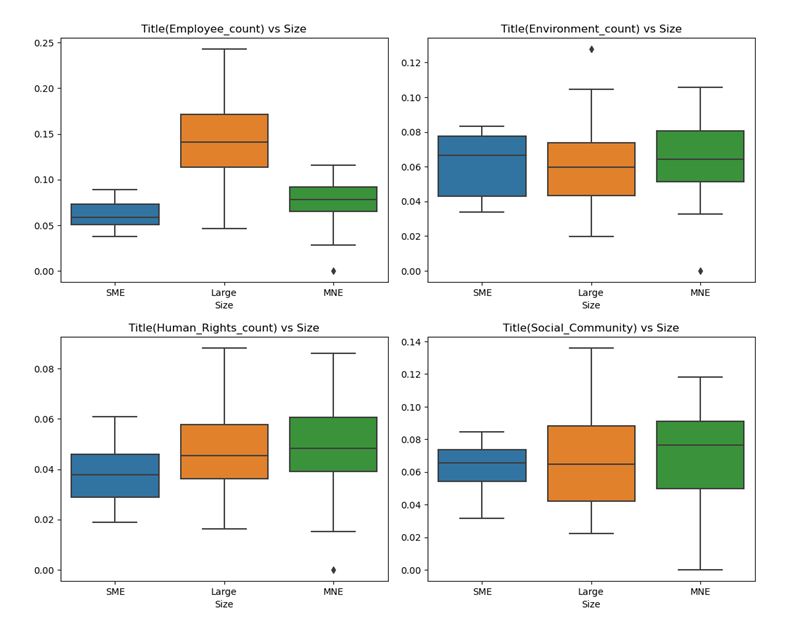
The Employee Topic is most visible in large-size companies, followed by MNEs and SMEs. Exceptionally interesting is the fact that Environment has the highest median value in SMEs, while Large companies have the lowest median value. In terms of human rights, MNEs report slightly more median values than large-sized companies. For the social topic, large companies come at the lowest median value, though the interquartile range is the biggest of the three. From a bird’s eye view, we can say that MNEs and SMEs are usually at the top, while large-sized companies have the lowest median values, except for the Employee Topic.
Conclusion
Based on the findings and linkages, several parallels can be drawn to help further research. Thus, the topics of human rights and the environment, as one of the most pressing issues of our time, have significantly spread internationally. Moreover, the most substantial overlap in MNEs underlines the preoccupation with these issues, including additional important ones. In the formation of international business processes, the issue of reputation is critical, and regionality does not play a meaningful role in this case.
The similar minimum median deviation for the main SDGs in all regions, regardless of the total number of reports, also confirms the trend of the increasing importance of social factors. The link between the activities of the fields of utilities, agriculture, and, to a lesser extent, energy is also evident in the context of CSR and SDGs, as they have the most significant relevance for the environment. Nevertheless, further examination is needed to determine the link between the results and regulation and to find the root causes, taking into account the policies of states and stakeholders, possibly in an averaged format.
In addition, a major disadvantage of such a quantitative statistical analysis process can be identified. The fact that reports are submitted and the information they contain may not always correspond to reality. Thus, there is a level of bias, which must inevitably be taken into account by readers and in further research. Unfortunately, many of today’s companies do not conform to their strategies and, in some cases, publish false information, as mentioned above. Thus, while the results show general trends in how businesses of different sizes consider social, environmental, and other factors, the final figures may not be accurate.
Bibliography
ACCP. (2021). Association of Corporate Citizenship Professionals. Web.
Davis, K. (1960). Can businesses afford to ignore social responsibilities? California Management Review, 2(3), 70–76. Web.
Elkington, J. (1999). Cannibals with forks: The triple bottom line of 21st-century business. Capstone Publishing.
Ellis-Hall, W. (2020). The importance of CSR and why a company should embrace it. DrpGroup.com. Web.
Fifka, M. S. (2013). Corporate responsibility reporting and its determinants in comparative perspective – a review of the empirical literature and a meta-analysis: Corporate responsibility reporting and its determinants. Business Strategy and the Environment, 22(1), 1–35. Web.
Freeman, R. E. (1984). Strategic management: A stakeholder approach. Pitman.
Friedman, M. (1970). The social responsibility of a business is to increase its profits. In Corporate Ethics and Corporate Governance (pp. 173–178). Springer Berlin Heidelberg.
GSIA. (2022). GSI-Alliance.org. Web.
Hahn, R., & Kühnen, M. (2013). Determinants of sustainability reporting: A review of results, trends, theory, and opportunities in an expanding field of research. Journal of Cleaner Production, 59, 5–21. Web.
Hayes, A. (2022). What is greenwashing? How it works, examples, and statistics. Investopedia. Web.
Hopkins, M. (1999). The planetary bargain: Corporate social responsibility comes of age. Palgrave Macmillan UK. Web.
Huang, X., & Watson, L. (2015). Corporate social responsibility research in accounting. Journal of Accounting Literature, 34(1), 1–16. Web.
ICL Blog. (2022). The evolution from CSR to ESG. ICL-Group.com. Web.
Igini, M. (2022). 5 fast-fashion brands called out for greenwashing. Earth.org. Web.
Jacob, C. K. (2012). The impact of the financial crisis on corporate social responsibility and its implications for reputation risk management. Journal of Management and Sustainability, 2(2). Web.
Khanna, C. (2021). Text pre-processing: Stop word removal using different libraries. Towards Data Science. Web.
Kingsley-Hughes, A. (2021). Apple! Stop greenwashing and start caring for the planet. ZDNET. Web.
KS19. (2021). What has CSR meant for climate change? Medium. Web.
Kuhn, J. W. (1991). Beyond success: Corporations and their critics in the 1990s. Oxford University Press.
Lindgren, C., Huq, A. M., & Carling, K. (2021). Who are the intended users of CSR reports? Insights from a data-driven approach. Sustainability, 13(3), 1070. Web.
Naskar, A. (2019). Latent Dirichlet Allocation for beginners: A high-level overview. ThinkInfi. Web.
Pencle, N., & Mălăescu, I. (2016). What’s in the words? Development and validation of a multidimensional dictionary for CSR and application using prospectuses. Journal of Emerging Technologies in Accounting, 13(2), 109–127. Web.
Rahman, S. (2011). Evaluation of definitions: Ten dimensions of corporate social responsibility. World Review of Business Research, 1(1), 166–176.
Saumyab271. (2022). Stemming vs lemmatization in NLP: Must-know differences. Analytics Vidhya. Web.
Selvin, S. (2019). The joy of statistics: A treasury of elementary statistical tools and their applications. Oxford University Press.
Tarantola, A. (2021). Is Big Tech “greenwashing” its environmental responsibilities ahead of COP26? Engadget. Web.
United Nations. (2022). 17 goals to transform our world. United Nations Sustainable Development. Web.
Wicker, A. (2022). H&M is being sued for greenwashing. What does that mean for fashion? The Cut. Web.