Data Analysis
This analysis is grounded on the US Department of Labor’s 2016 Consumer Expenditure Surveys, one of the main sources of information on the composition of households and their annual expenditures in the US. Based on this data, the following scenario was formulated: The annual expenditure used by a 42-year old head of household with a $90,000 annual income having 2 children. In addition to income, other socioeconomic variables that were considered included housing and food expenditures, marital status and family size.
Data Set Description and Method
This analysis used a study sample size of 30 households. Both quantitative (Income, housing and food expenditure, family size) and qualitative (marital status) data were analyzed. This was performed on the Microsoft Excel version 2013 software. Descriptive statistics were used to represent the information in the data set. These comprised the measures of central tendency being mean, mode and median, and measures of spread entailing standard deviation.
Results
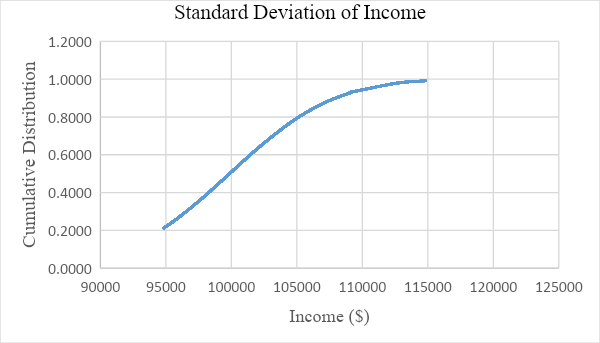
Income
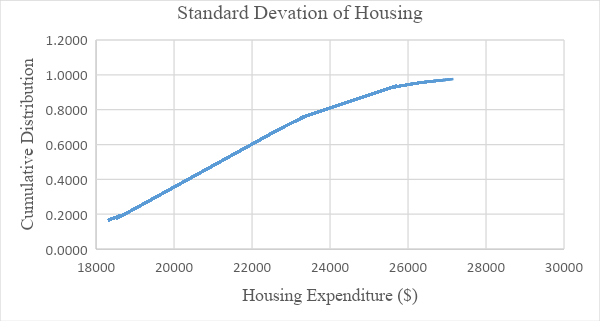
Housing
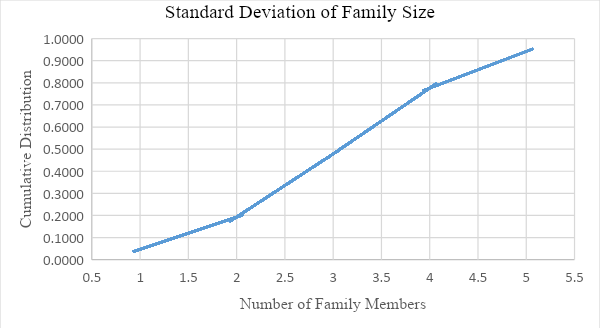
Family Size
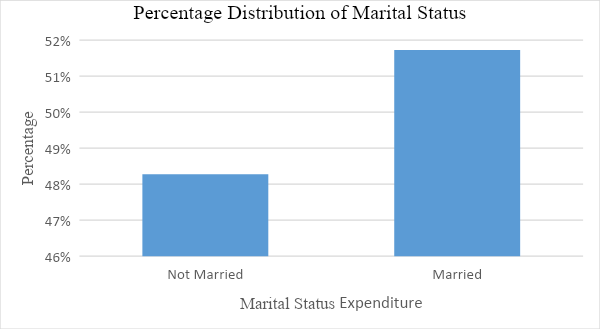
Marital Status
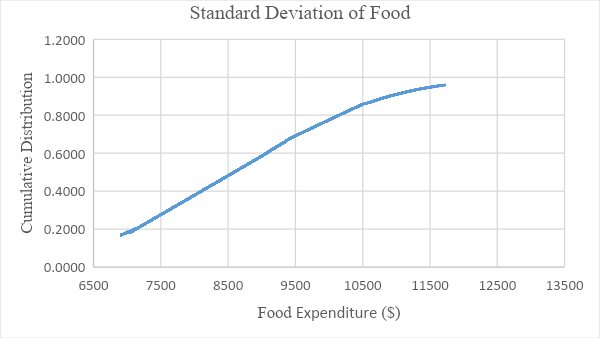
Food
Description of Findings
Specific measures of central tendencies and dispersion were used as they were relevant to the research’s aim. For instance, overall, frequency, mean, median, and sample standard deviations were used as distinct variables were quantitative. In addition, the median served the best purpose in the case that data was not normally distributed, that is, it negated the effect of outliers and skewness of data. On the other hand, the mean was used as it includes all data presented in the sample set. Lastly, the sample standard deviation was used as the only measure of dispersion primarily because the data set being analyzed is a derivative of the whole U.S. population. Therefore, it allows for the generalization of findings. On the contrary, with regards to qualitative data, mode and percentage distribution were employed as the variable was nominal.
All the standard deviation curves representing income, housing, and food expenditure, family size have a gentle slope. Consequentially, this illustrates that data is not centered on the mean, and instead, it is spread out over a wider range of values. On the other hand, when it comes to marital status, the percentage distribution of the head of households that were married was 4% more than those who were not married.
Discussion and Conclusion
The study of household budget allocation is among the most traditional topics in economics. Based on the scenario presented, the annual household income of $90,000 is relatively closer to the sample’s median household income of $96,680. 50. Therefore, this suggests that this family can be regarded to belong to the middle class. Furthermore, the household is of average size as it constitutes 4 members, which is comparatively closer to the average family size of 3.5 of the overall data set.
Other variables that were analyzed included food and housing. Housing had a higher expenditure as its median annual expenditure was $20,528; however, that of food was $8,052. Housing is often an average person’s greatest monthly expense; nevertheless, an individual needs to ensure that no more than 30% of the household income is utilized. This is because, based on the United States National Housing Act of 1937, housing expenditures exceeding this percentage have been regarded as an indicator of a housing affordability problem (Herbert et al., 2018). Therefore, this indicates that there lacks a housing affordability issue. Nevertheless, more money will be saved if the housing expenditure is reduced.
Reference
Herbert, C., Hermann, A., & McCue, D. (2018). Measuring housing affordability: Assessing the 30 percent of income standard. Joint Center for Housing Studies of Harvard University. Web.