Statistics has found its way into various disciplines of healthcare not being an exception. Data collected has been used to help employees and management to make a rational decisions regarding the wellbeing of clients or patients. Ideally, data collected from samples of populations are used to either describe or infer something about the given population (Sullivan, 2007). The task of this paper is to use SPSS to carry out descriptive analysis of data.
Problem 2.1
Mean and standard deviation for age
From table 1 above it is evident that the mean age of the respondents was 37.69 years while the standard deviation stood at 12.114 years. The mean represents the average or expected age of the respondents. On the other hand, standard deviation shows or explains how much variation or dispersion exists from the average or mean. In this case, the dispersion is 49 years and 25.69 years.
Scatter-plot for age
It is worth noting that there is no way one can produce a scatter plot for a single variable. Ideally, scatter plots are usually produced to show if a relationship exists between two variables. This is useful in helping analysts perform correlation and regression analysis (Pallant, 2007). For the sake of illustration, I will produce a scatter plot of age and the amount of alcohol consumed by the respondents.
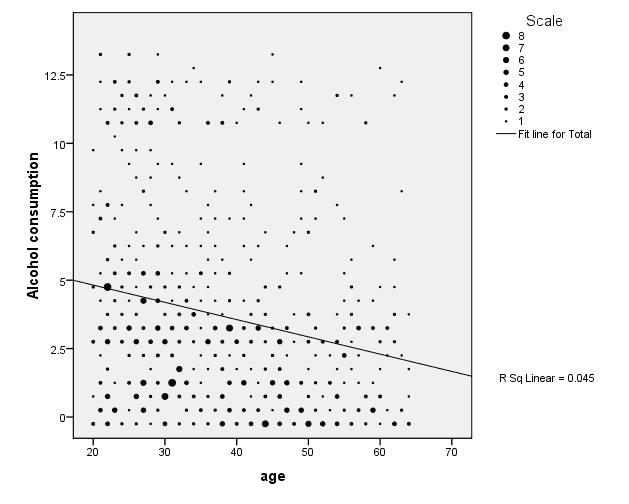
From figure 2 it is evident that there is a relationship between the amount of alcohol consumed and the age of the respondents. It is apparent that individuals who are younger consumed more alcohol compared to older members of society. This can be attributed to health statuses, where older members of the society are discouraged from taking more alcohol for the sake of their health (Polit & Beck, 2003).
Box-plot for age
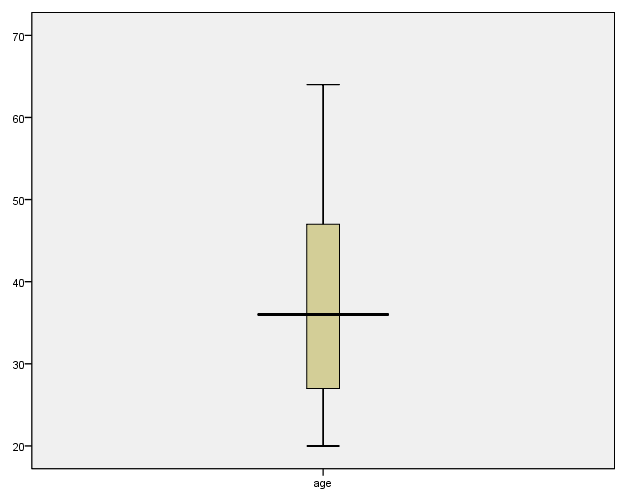
Box-plot is utilized by researchers to picture the median as well as quartiles association with continuous variable. Looking at the box-plot gives the reader a quick idea of how the data is distributed. In the analysis there were no missing cases. Table 2 gives the summery of the variable analyzed, aged. From figure 2, the box represents the middle 50.0% of the sample between 25th and 75th percentiles (Pallant, 2007). The middle line in the box represents the mean while the extreme horizontal lines at the upper and lowest part of the box represents the highest and lowest values.
Table 2 Descriptive statistics for age.
Histogram for age
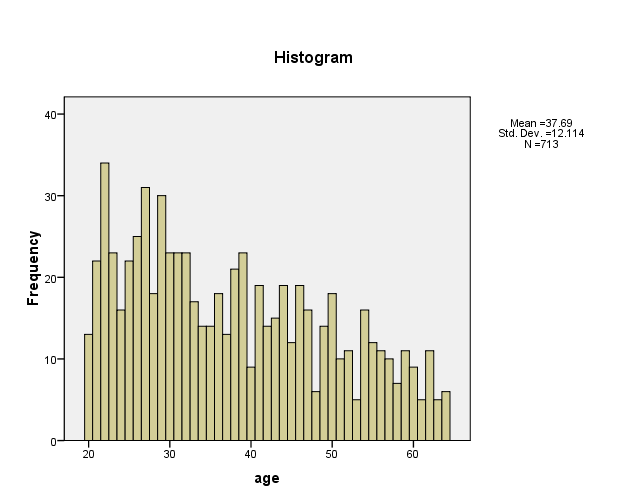
From figure 3 the mean and standard deviation for age is 37.69 and 12.114 years respectively. Majority of the respondents seems to be between 20 years and 40 years. The distribution is negatively skewed.
Expected distribution
From a close examination of the produced box-plot and histogram for age, it is apparent that majority of the respondents falls in the age bracket of 20 and 40 years. If a normal curve is to be fitted on the histogram, it will be easily seen that the distribution is skewed to the left.
Problem 2.2
Bar chart for age group
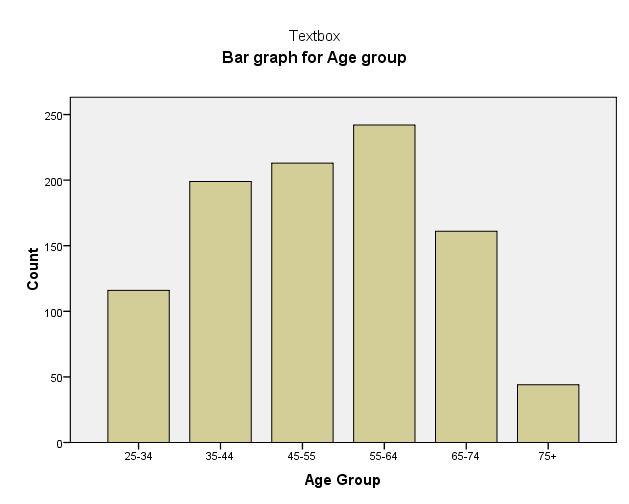
From figure 4, it is evident that the heights of the bar graphs indicate the frequencies. Individuals between age 55 and 64 years are the majority followed by those between 45 and 55 years. The least represented are those over 75 years old.
Representation of age
From the two problems, it is evident that from problem 1, the age is represented as ungrouped data while in problem 2 the age is represented as grouped data. The data is categorized into groups.
Choosing to use grouped data
The desire to use a grouped data can be justified if one wishes to carry out an analysis with the aim of establishing relationships based on age groups (Pallant, 2007). Additionally it helps reduce the volume of data as well as making it possible to carryout analysis such as cross tabulation.
The only challenges with the steps are with regards to missing variables in the data set. However, the steps were easy to follow.
References
Pallant, J. (2007). SPSS Survival Manual: A Step-by-step Guide to Data Analysis Using SPSS. Crows Nest, NSW: Allen & Unwin.
Polit, D. & Beck, C. (2003). Nursing Research: Principles and Methods. Philadelphia: Lippincott Williams & Wilkins.
Sullivan, L. (2007). Essentials of Biostatistics in Public Health. New York: Jones & Bartlett Learnin.