Ethogram Definition
This field assignment utilized observation of a sea crab that lives on coastal rocky embankments. The video was taken during a recent coastal vacation and satisfies the one-minute observation of crustacean behavior. In fact, there were several crabs in the live observation field at once, about 4-6 crabs, but the video captures only one that caught the eye by its wariness. A completed table identifying the four patterns of crab behavior is offered below.
Table 1 – Qualitative Description of Behavior.
Exploring the territory is a precautious behavior used to locate objects that may interact with the creature. The crab uses this technique at 00:14, 00:19, and 00:33, possibly as a defense mechanism to see threats in advance. While the use of eyes seems logical, this claim has no basis in the observational material, and the perception medium may differ. For example, it can be sound or ground vibrations. The result of this behavior is hiding, which is seen at 00:54. This effect could be caused by an external factor, like sudden sound or movement, that could be indicated as a threat. The exploring behavior may also result in other outcomes, including feeding, which is also present in the video.
In fact, it is unclear from the video exactly what the crab is doing at the moment of eating. The animal does not grab food from the surface of rocks or from the water and never touches the ground with its main claws at all within the video. However, at 00:29 – 00:32, it is clearly visible that the crab brings its left claw to its mouth, opens its mouth, and engulfs an unidentified something. Given the general behavior of this animal, it is likely that the crab ate something, but what it was and where it came from remains unknown.
Filled Ethogram
In the next part, it was necessary to quantitatively study the behavioral patterns of the crab under study. Since the crab shows dynamic behavior throughout the minute, counting was based on changing patterns. For example, if a crab first warily stopped, then walked, and then stopped again, the count showed two patterns of exploring the territory and one pattern of walking. The results of the quantification are shown in the table below.
Table 2 – Quantification of Behavior.
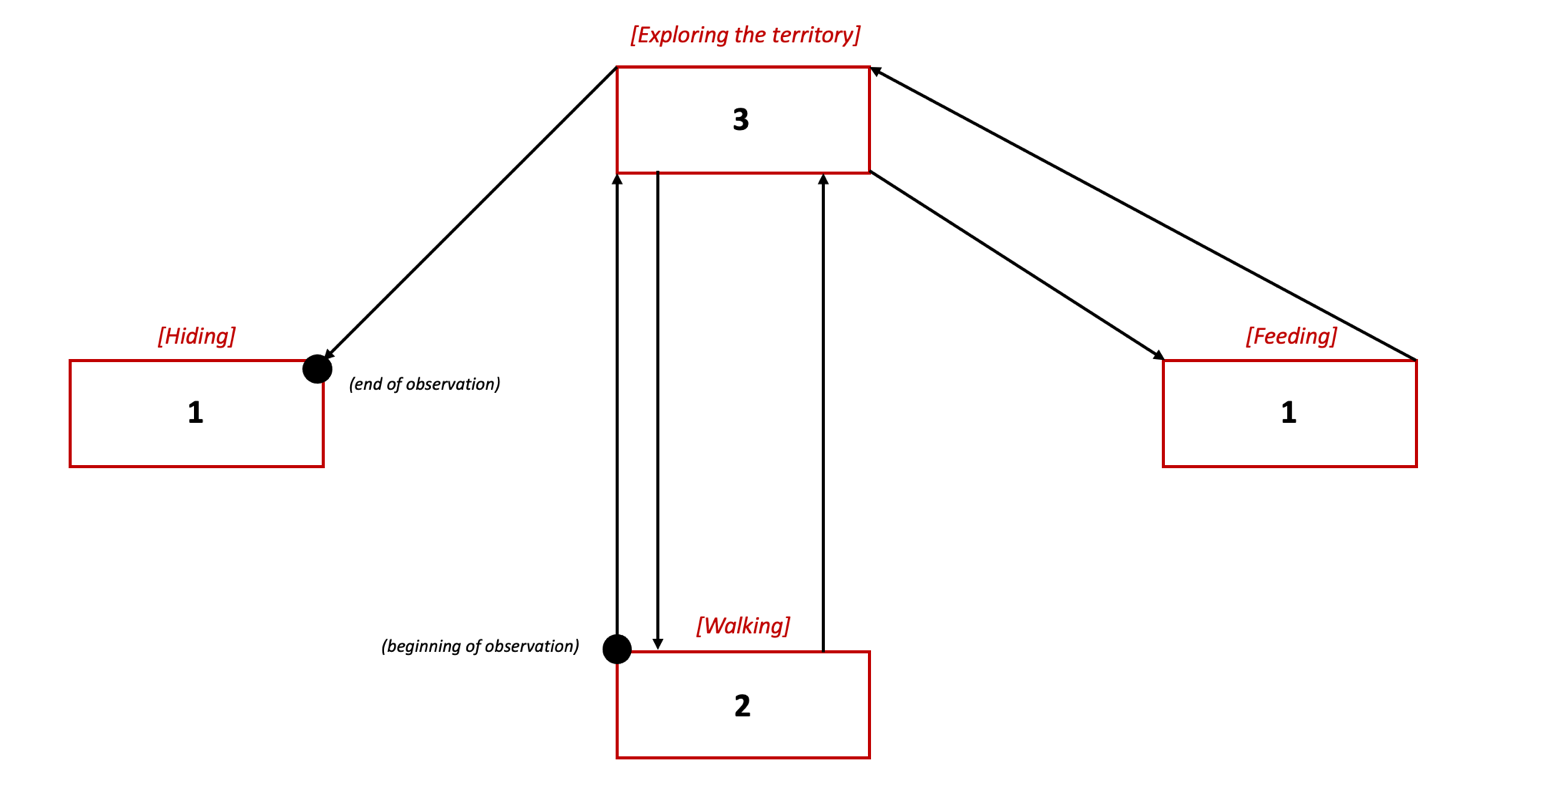
Transition Matrix
The patterns studied were plotted on a transition matrix, which contains both the results of the quantification of behavior and a description of the sequence. Strictly speaking, the transition matrix is used to map previously collected data on behavioral patterns and their quantities, arranging them in an observation sequence (Gribovskiy et al., 2019). This matrix is shown at the bottom and contains rectangular blocks (detected behavioral patterns), numbers (the number of their execution), and an arrow illustrating the order of actions of a given animal. The matrix above also shows the start and end points of the observation, which allow the order of arrow learning to be easily identified. It is clear from the results that, for the most part (from a quantitative point of view), the crab was wary of exploring the territory and did not undertake any active behavior between its two points.
Reference
Gribovskiy, A., Mondada, F., Deneubourg, J. L., Cazenille, L., Bredèche, N., & Halloy, J. (2019). Automated analysis of behavioural variability and filial imprinting of chicks (G. gallus), using autonomous robots [PDF document]. Web.