Problem Background
Statistical data reporting is part of research based on information collection, analysis, interpretation, and inference. One of the issues with this approach is choosing the wrong approach to data collection or analysis, which can lead to potentially inaccurate data. Due to flawed design, ignorance, or personal bias, a researcher may report inaccurate data to an audience that can have significant consequences. Considering this problem, this paper decided to validate published statistics critically. The paper proposes to refer to the data published by Elflein (2023), who reports that as of 2021, 45% of individuals slept up to 7 hours, 44% slept between 7 and 9 hours, and 11% of individuals slept more than 9 hours in 24 hours. This research paper proposes to either agree or refute the published data by conducting an additional statistical study on a random sample.
Data Collection
One of the fundamental tasks of a research project on which the quality of the published results depends is the collection of quantitative data. A simple sampling is the right choice as it ensures that all individuals from the population have an equal chance of being sampled and no bias in the results is observed (Mahmud et al., 2020). Simple random sampling was used to collect information from individuals. Specifically, a quick online questionnaire was prepared on the Google Forms platform, with an invitation link distributed to the author’s social media contacts.
To ensure randomization, all current contacts from Snapchat, Facebook, Twitter, and Instagram with whom it was possible to exchange messages were written out in an MS Excel spreadsheet. Randomization was ensured by assigning a random number to a row using RAND() and further sorting: out of the total number of candidates (N = 319), only one in three was selected to be invited into the sample; if an individual declined, the next participant was selected. Thus, the final sample size was 104 individuals, yielding 32.6% of the initial population of potential candidates.
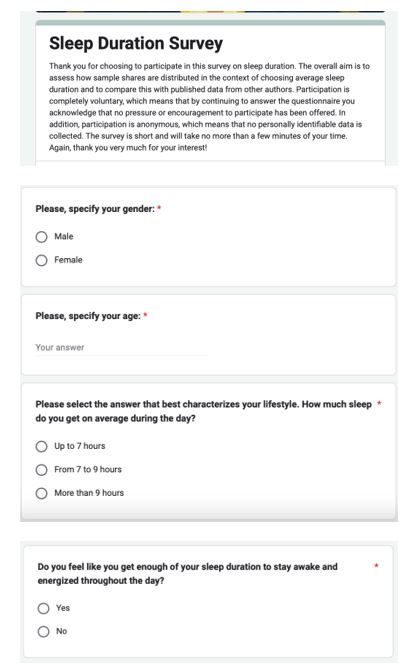
The questionnaire offered for completion was short enough to motivate individuals to complete the survey but still contained all the necessary data. After an introductory paragraph with informed consent, the participant was only required to answer four questions — the complete questionnaire can be found in Appendix A. Thus, the data collected included brief demographic information (age and gender) and core block data (sleep duration and perception of sleep adequacy).
Organization of Data
The data exported from Google Forms was analyzed in IBM SPSS. For demographic data, it was examined that most of the sample was female (71.2%, n = 74), and 28.8% (n = 30) identified themselves as male. In terms of age distribution, it was shown that the mean age of the sample was 35.2 (SD = 10.4) years. Thus, the average participant profile was represented by a young female, consistent with the generalized population profile from the author’s contacts.
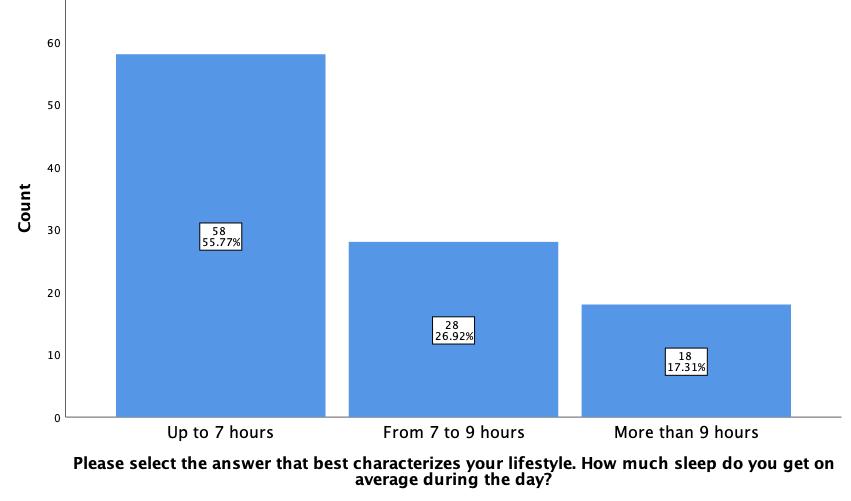
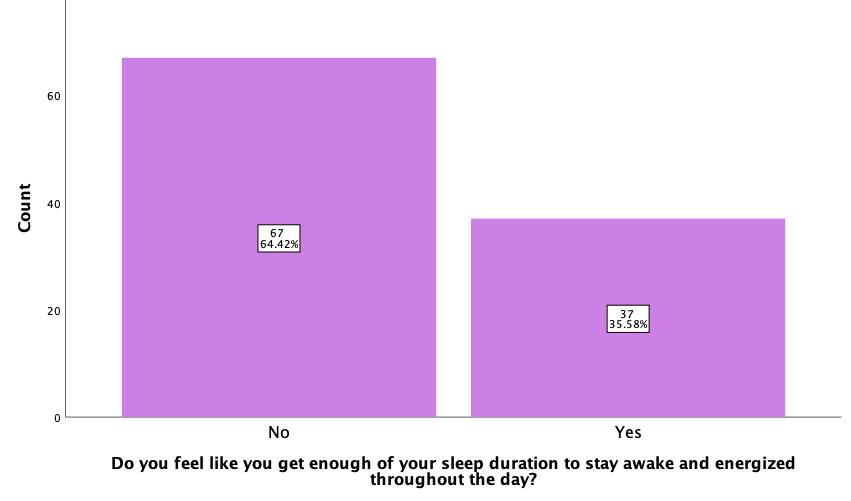
In terms of the central questions of the questionnaire, Figure 1 shows the frequency and percentage distribution of mean sleep duration for the sample. As shown from the histogram, the majority of respondents (55.77%, n = 58) selected sleep duration up to 7 hours as a characteristic, 26.92% (n = 28) indicated that they sleep between 7 and 9 hours on average, and finally, a smaller proportion (17.31%, n = 18) selected sleep duration above 9 hours. Figure 2 shows the distribution of respondents’ answers as to whether or not respondents were getting enough of their sleep duration. As the bar graph shows, 64.42% (n = 67) of respondents indicated that their current sleep duration was insufficient to feel alert and energized during the day; in contrast, 35.58% (n = 37) reported that their current sleep duration was sufficient.
Thus, the data were organized based on the characterization of the sample proportion consisting of the author’s random personal contacts. In this case, the population was represented by all of the author’s social media contacts (N = 319) with whom there was a possibility of exchanging messages. The population variable, therefore, is the proportion of people as a function of sleep duration, whereas the sample statistic is a similar variable but for sample data. The variable was presented on a nominal scale with three levels, measuring average daily sleep duration.
Data Output
Confidence Interval
Utilizing the entire population is impractical given the typically huge population sizes, the low availability of each participant for direct data collection, and resource and time constraints. Instead, there is an approach in statistics that allows us to extrapolate sample data to the population, namely confidence intervals. There is a rule about confidence intervals: the higher the level of accuracy desired, the more comprehensive the range of numerical values. Since, in the present study, the population parameter is represented by a percentage, the following formula was used to calculate the confidence interval:
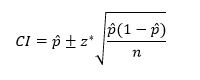
First, we can expect with 90% accuracy that the average number of people in the population whose sleep duration is up to 7 hours ranges from 47.8% to 63.8%, 90%CI [0.478, 0.638]. Second, with 95% accuracy, the average number of people with sleep duration of up to 7 hours would be expected to range from 46.2% to 65.3%, 95%CI [0.462, 0.653]. Third, with 99% accuracy, the average percentage of the population that sleeps for up to seven hours should fall between 43.2% and 68.3%, 99%CI [0.432, 0.683]. The remaining variable categories, with both confidence interval and Margin of Error, are summarized in Table 1.
Table 1: Results of calculations of confidence intervals for the data.
Hypothesis Testing
Elflein (2023) states three null hypotheses, namely:
- 45% of the population have an average sleep duration of up to 7 hours.
- 44% of the population have an average sleep duration of 7 to 9 hours.
- 11% of the population have an average sleep duration of 9 hours and above.
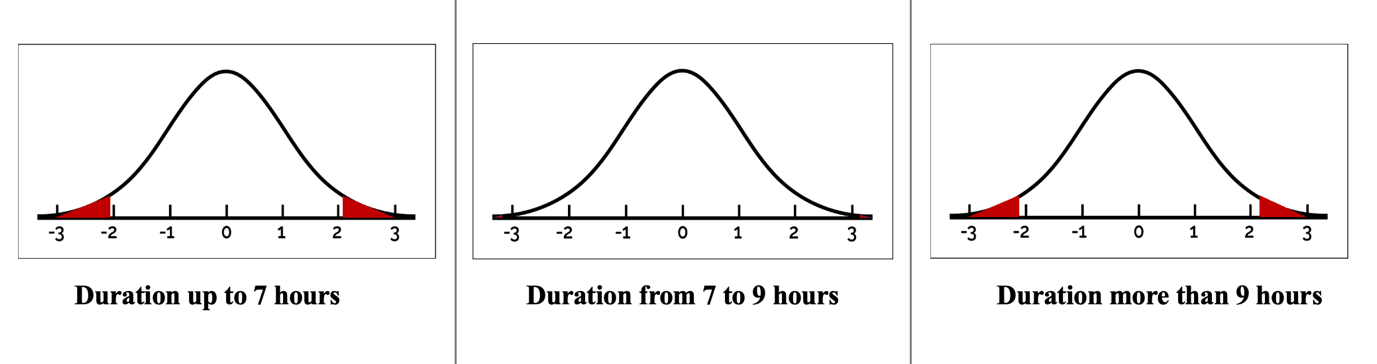
A one-sample z-test was used to assess the statistical significance of differences between the sample and the reported proportions for each level (Figure 3). For the first hypothesis, the difference was statistically significant (z = 2.21, p = 0.027). For the second hypothesis, the difference was also statistically significant (z = -3.51, p = 0.000). Finally, for the third hypothesis, the difference was also statistically significant (z = 2.06, p = 0.040). This implies that the sample values found were statistically significantly different from all three proportions, Elflein (2023) suggested. In other words, the results reported by the authors are not supported by the sample findings.
References
Elflein, J. (2023). Share of U.S. adults who slept a select number of hours per weekday from 2019 to 2021. Statista. Web.
Mahmud, M. S., Huang, J. Z., Salloum, S., Emara, T. Z., & Sadatdiynov, K. (2020). A survey of data partitioning and sampling methods to support big data analysis. Big Data Mining and Analytics, 3(2), 85-101. Web.
Appendix A — Sleep Duration Survey