Abstract
The COVID-19 pandemic was a global event that significantly disrupted the established order of life. In addition to its obvious economic and political consequences, the pandemic has also shown significant effects on the social sphere. This laboratory report critically examines the effects of strict isolation and social distancing on perceptions of self-satisfaction. Personal characteristics of the individual, such as extraversion and belonging to social groups (social connectedness), are used as predictors. It was shown that connectedness is a significant predictor of life satisfaction, and a drop in this parameter negatively affects satisfaction. Thus, this paper characterizes relevant and useful academic material, highlighting the statistical study’s course and critically evaluating the results obtained.
Summary
Qualitative studies of life satisfaction are fundamentally important for the psychosocial sciences, as they allow not only to find resources for improving living conditions but also to identify the predictors responsible for this satisfaction. There is no doubt that the mentioned characteristic is a subjective perception of the environmental reality in which an individual is brought up and works. Since the perception is primarily influenced by the criteria of need satisfaction, emotional balance, and accessibility of necessary infrastructures, comprehensive sociological studies of satisfaction are most relevant. Nevertheless, it is a mistake to assign to this perception of the environment the features of only subjective attitude since there are examples of global events that qualitatively change entire communities’ lives.
In the context of this psychological study, such an event is the COVID-19 pandemic, a viral disease that disrupted the stable order of life in a large number of human communities. The pandemic has severely affected states’ economic and political relations, but the actual range of effects is much broader. More specifically, among most of the adverse effects, special attention should be paid to society’s structures since the pandemic has put tremendous pressure on the social ties between individuals (Okabe-Miyamoto et al., 2021; Modersitzki et al., 2020). Large numbers of blockages, broken transport chains, distancing, and remote work have caused changes in society’s composition in the context of an individual’s social activity and life satisfaction.
In this context, the most intriguing research questions are to determine the degree of connection that exists between the emergence of the pandemic, and hence the establishment of social restrictions, and the degree of life satisfaction. Since this term is entirely subjective, the study of satisfaction can be conducted through the categories of extraversion and social connectedness. Extraversion in this laboratory report refers to such a psychological property, which characterizes the outward orientation of personal attitudes (Watson et al., 2019). On the other hand, social connectedness is defined as a factor that complements spatial development and reflects the formation of new socioeconomic communities in spatial settings (van Tilburg et al., 2019). Thus, it is clear that both criteria are strongly associated with community engagement, and thus it is reasonable to expect that the proliferation of restrictive measures related to COVID-19 had a severe effect on them and life satisfaction in general (Wijngaards et al., 2020). Consequently, the working hypothesis assumes that the categories of extraversion and social connectedness lead the individual to major psychosocial problems related to life satisfaction, triggered by the widespread implementation of strict restrictive measures in relation to the COVID-19 pandemic. The purpose of this laboratory report is to summarize and critically analyze the findings in order to confirm or refute the stated hypothesis.
Method
Since the authors of this report recognize the subjective nature of the perception of life satisfaction, a structured sociological survey was chosen as the primary research tool. More specifically, the survey was created on an online platform and was sent out to a large group of people with no sample limit on the number of participants. The survey was structured into five sections: introductory questions, extraversion/introversion scale, social connectedness and environment, life satisfaction, concluding paragraphs thanking respondents, and mentioning contacts for collaboration. To test the validity of the responses, participants were offered interim controls to determine the relevance and reliability of the collected results at a later date. Most questions consisted of a numerical scale with linked verbal descriptions so that the participant could label the answer to the proposed question with a number, where the smallest number, 1, characterized strong disagreement with the statement (the text of the questionnaire is provided in Appendix A).
Because each value in the response pool was assigned a numerical value, results were processed using quantitative statistical analysis tools. Specifically, Descriptive Statistics Tables were created to show overall trend measures in each of the three key sections of the social experiment. In addition, correlations between the two criteria and life satisfaction separately were examined. To process the data, it was used standard MS Excel software, automatically calculated the necessary criteria and values.
Participants
Because the online questionnaire did not regulate the number of participants, each of the study authors sent a link to participate through social networks. Thus, a central proportion of participants were acquaintances, relatives, and friends of the researchers who independently completed the online form. No demographic characteristics were collected either through the survey or in person. At the end of the response period, the final number of participants was 174 who responded to all questions.
Experimental Design
In this study, respondents were not divided into any groups or samples. In addition, no control group was created. This was done intentionally because the social opinion survey involved filling out the forms individually without outside support. On average, it took about twenty minutes to complete and did not cause any discomfort to the participants. The latter assertion is supported by the respondents’ personal statements at the end of the test and the trend of the responses to the checkpoints regarding the emotional connotations of completing the form (see Appendix A). For the total number of participants, those who answered all questions thoroughly were examined, as the consistency and systematicity of completing the questionnaire mattered. For this purpose, summary response statistics were examined in detail, and any forms that were partially or not at all answered were not used for further study.
The extraversion and social connectedness criteria established earlier in the second and third sections of the online questionnaire were used as independent variables for this trial. Since it was expected that these very parameters directly influence the psycho-emotional state of individuals in conditions of restriction, the degree of life satisfaction acted as a dependent variable. It was measured using statistical tools built into MS Excel, including correlation models reflecting the correlation between the independent and dependent variables.
Materials and Measurements
Materials
- Online questionnaire form sent via social contacts to a large number of respondents.
Measurements
Psychological testing involves measuring primary states of interest among respondents by reformatting verbal expressions into numerical notations. Thus, the measurement of psychosocial tendencies was carried out through in-depth statistical processing of numerical data. It was carried out through the functionality of MS Excel:
- Descriptive statistics.
- Paired correlation analysis.
- Linear regression modeling.
- Residual analysis.
- ANOVA test.
- Collinearity diagnostics.
- Single-tailed Reliability Analysis.
Procedure
The starting point for initiating the study was the authors’ personal motivation to explore the relationships between the criteria under discussion. The first step in conducting this laboratory test was a detailed review of the existing scientific literature, more broadly revealing the problem at hand. Once the literature review was completed, the examiners formed a working hypothesis and determined the format that was subsequently used to collect the data. Preparation of the online questionnaire form took time because academic sources describing grading scales were used to develop it (Oliver & Soto, 2015; Lee et al., 2001; Diener et al., 1985). Participants had approximately seven days to complete the survey, and the response function was closed at the end of the deadline. The next step was to analyze the summary statistics of respondents’ responses to exclude any irrelevant material and filter out only those data that were useful. As mentioned above, partially completed or blank forms were removed from the responses. The collected data, which underwent initial filtering, was loaded into the MS Excel environment, in which statistical analysis of several directions was performed. At the end of the analysis, a complete check of the results and corrections, if necessary, was performed. Finally, the laboratory study’s final step was to document this report summarizing the trial and summarizing the key results.
Results
Since the methodological part of this study focused on several objectives in sequence, the statistical processing’s central results were the overall measures of trend, correlation, and regression analysis, combined with reliability checks of the results and analysis of variance for each section of the questionnaire. Thus, descriptive statistics for the overall data collection results were analytically prepared first (Table 1). It was shown that the highest mean value for responses was characteristic of the social connectedness scale, although this measure is explained by the total number of discussion questions, namely 12:19:5 for the variables, respectively.
Table 1. Elements of descriptive statistics for each of the three key sections of the questionnaire
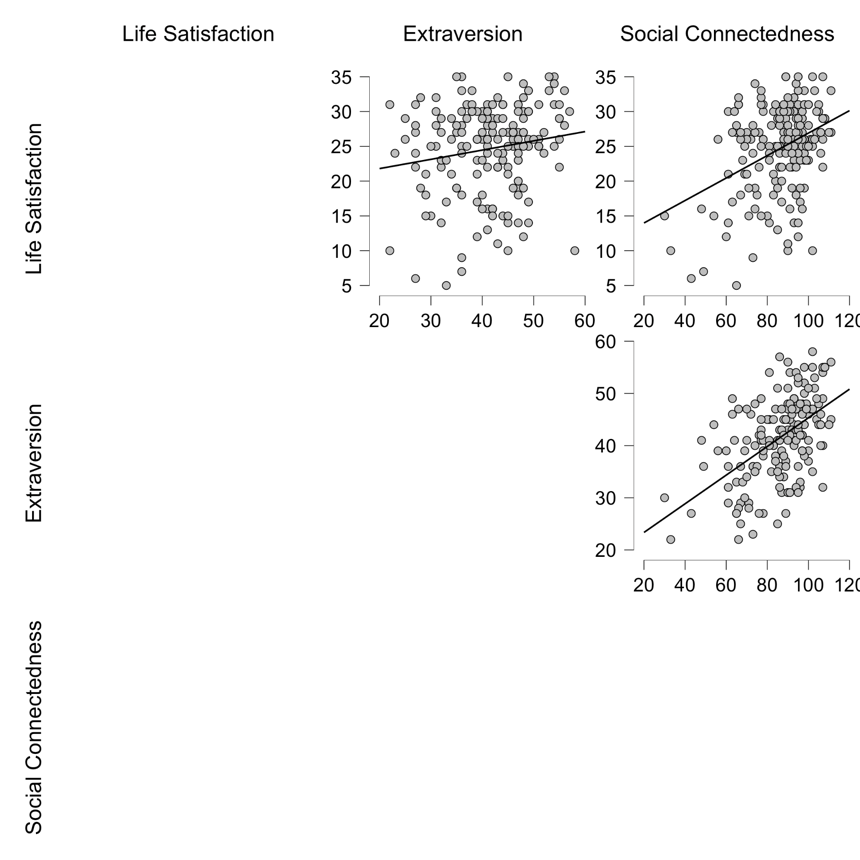
Upon completing the primary data processing, a bivariate linear correlation analysis of the numerical arrays through the Pearson coefficient was implemented both through tabular forms (Table 2) and a visual depiction of dependency plots (Figure 1), was conducted. More specifically, a weak correlation was found between extraversion and individual life satisfaction (PCC = 0.164, p-value = 0.030). More intriguing results were found for the relationship between social connectedness and life satisfaction (PCC = 0.381, p-value <0.001) and between the two independent variables (PCC = 0.524, p-value <0.001).
Table 2. Results of correlation analysis by Pearson coefficient
An alternative hypothesis test was performed using a linear regression model to determine the possibility of assuming a linear relationship between the parameters under study. The analysis results are reflected in Table 3, which critically compares the regression results for the null and alternative hypotheses regarding the relationship between extraversion (H0 model) and social connectedness (H1) of the subjects and the degree of life satisfaction. Based on the data obtained, it can be established that the regression model for the relationship found between social connectedness and life satisfaction is linear, and its equation might look as follows:

Table 3. Linear regression analysis outputs for two measurements
The results obtained can lead to intriguing conclusions, but it is necessary to verify their reliability. For this purpose, statistical tools such as the ANOVA test of variance (Table 4), refinement of regression through multicollinear analysis (Table 5 and Table 6), residual analysis with the construction of a residual distribution chart were used consistently: Figure 2, Figure 3, and Figure 4. Furthermore, as a final check, Cronbach coefficients for each dimension were calculated through a single reliability test: this is shown in Table 7 and Table 8, and Table 9.
Table 4. Results of the ANOVA dispersion test
Table 5. Data from the coefficient analysis of collinear statistics
Table 6. Collinear diagnostic results
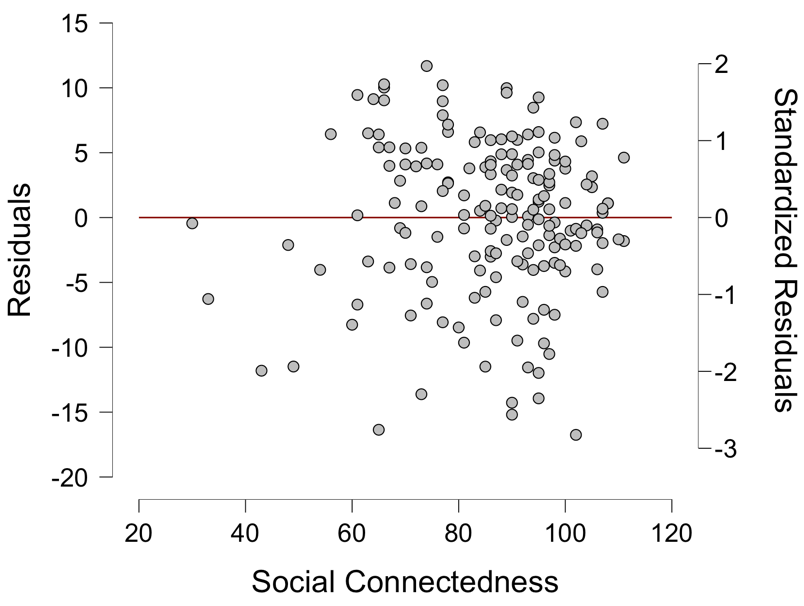
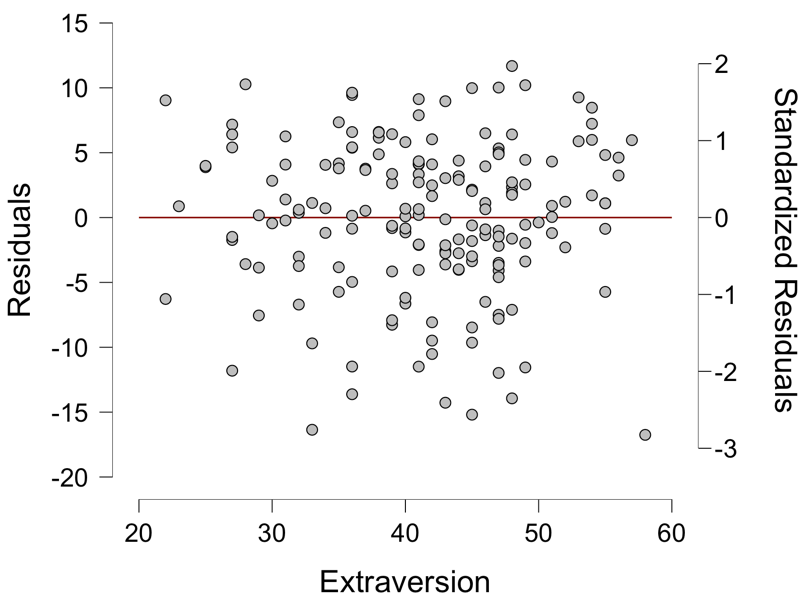
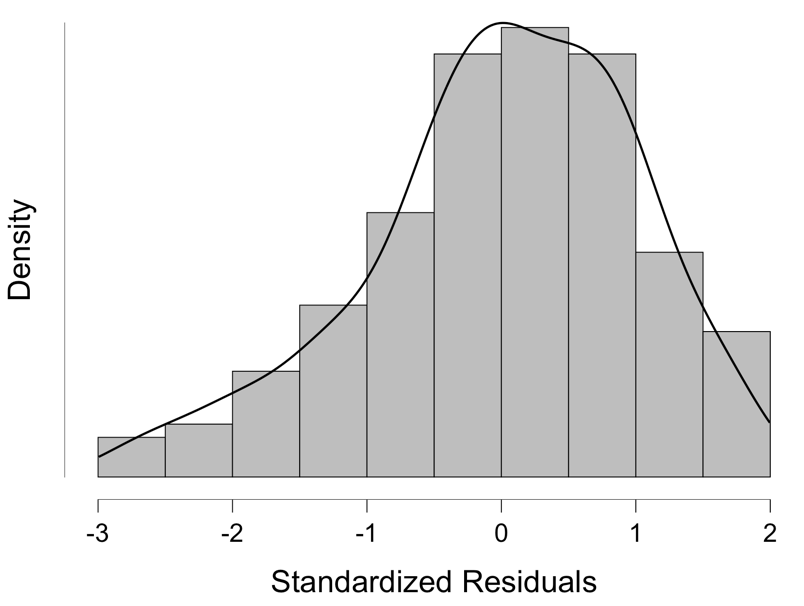
Table 7. Results of the single reliability test for extraversion
Table 8. Single reliability test results for social connectedness
Table 9. Single reliability test results for life satisfaction
Discussion
This study’s fundamental core was the need to critically evaluate the potential relationship between an individual’s personality states and the limitations initiated by the COVID-19 pandemic. The central index in any individual’s life is satisfaction with the quality of one’s own life. It should be understood that this measure is a subjective reflection of reality’s perception, and therefore directly depends on the personal qualities of the subject. This idea was used in an experiment that evaluated the relationship between extraversion and social connectedness under pandemic conditions. Consequently, it is appropriate to state that this work was created in response to a research request for a qualitative assessment of the correlations between the criteria above.
The following causal relationship has been hypothesized in this study. Restrictive measures caused by the requirement of social distancing and isolation resulted in those with solid extroverted traits and those more in need of social belonging (social connectedness) experiencing the most pressure, which means that subjective perceptions of life satisfaction were hurt (Folk et al., 2020). The experiment conducted in this paper aimed to measure the degree of correlation and determine the possibility of linear regression for the dependencies of life satisfaction on two predictors. The test results were statistical calculations highlighting the components of descriptive statistics, bivariate correlation analysis, linear regression analysis and measurement of reliability results, ANOVA variance test, and one-way reliability testing (hence, using Cronbach’s coefficients).
Specifically, it was shown that the highest correlation was found between an individual’s desire for social connectedness and life satisfaction (PCC = 0.381, p-value <0.001). The findings can be interpreted as the fact that the subject’s desire for social connectedness affects personal life satisfaction. It is noteworthy that similar results can be traced to the actual work of Nitschke et al. (2020), in which it was shown that a more significant number of social contacts reduced perceived stress in isolation. In addition, the results found a positive correlation between extraversion and social connectedness r(171)= 0.524, p <.001. Given that extroverted individuals often tend to belong to different social groups, this finding does not seem surprising.
Based on the findings, it is possible to postulate the patterns found between the measured parameters. In particular, social connectedness was a significant predictor of life satisfaction (β1 = 0.41, p < 0.001), whereas extraversion was not (β2 = -0.05, p = 0.56). Linear regression also showed that there was a linear relationship between social connectedness and life satisfaction, and this increase was very rapid, as for every unit of connectedness, there was a 0.17 increase in satisfaction (adjusted R2 = 0.137). In addition, this model fit the data significantly, as F(2, 171) = 14.718, p = <0.001, which explains 14.7% of the variance in life satisfaction values.
Finally, in order to confirm the quality of the results obtained, additional statistical tests were performed. It was shown that the residuals diagram has a normal distribution function, which reflects the homoscedasticity of the data. The calculated Cronbach’s coefficients and ANOVA test also confirmed the reliability of the results. Consequently, it can be concluded that social connectedness was the only statistically significant predictor of life satisfaction. In the context of the COVID-19 pandemic, this might indicate that strict isolation and social distancing could cause stress and hence reduce life satisfaction in the subject group.
References
Diener, E. D., Emmons, R. A., Larsen, R. J., & Griffin, S. (1985). The satisfaction with life scale. Journal of personality assessment, 49(1), 71-75.
Folk, D., Okabe-Miyamoto, K., Dunn, E., & Lyubomirsky, S. (2020). Have introverts or extroverts declined in social connection during the first wave of COVID-19. Web.
Lee, R. M., Draper, M., & Lee, S. (2001). Social connectedness, dysfunctional interpersonal behaviors, and psychological distress: Testing a mediator model. Journal of counseling psychology, 48(3), 310-318.
Modersitzki, N., Phan, L. V., Kuper, N., & Rauthmann, J. F. (2020). Who is impacted? Personality predicts individual differences in psychological consequences of the COVID-19 pandemic in Germany [PDF document]. Web.
Nitschke, J. P., Forbes, P. A., Ali, N., Cutler, J., Apps, M. A., Lockwood, P. L., & Lamm, C. (2020). Resilience during uncertainty? Greater social connectedness during COVID‐19 lockdown is associated with reduced distress and fatigue [PDF document]. Web.
Okabe-Miyamoto, K., Folk, D., Lyubomirsky, S., & Dunn, E. W. (2021). Changes in social connection during COVID-19 social distancing: It’s not the (household) size that matters, it’s who you’re with. Plus One, 16(1), 1-16.
Oliver, P. J. & Soto, C. J. (2015). The Big Five Inventory–2 (BFI-2) [PDF document]. Web.
van Tilburg, W. A., Sedikides, C., Wildschut, T., & Vingerhoets, A. J. (2019). How nostalgia infuses life with meaning: From social connectedness to self‐continuity. European Journal of Social Psychology, 49(3), 521-532.
Watson, D., Stanton, K., Khoo, S., Ellickson-Larew, S., & Stasik-O’Brien, S. M. (2019). Extraversion and psychopathology: A multilevel hierarchical review. Journal of Research in Personality, 81(1), 1-10.
Wijngaards, I., de Zilwa, S. C. S., & Burger, M. J. (2020). Extraversion moderates the relationship between the stringency of COVID-19 protective measures and depressive symptoms. Frontiers in Psychology, 11(1), 1-9.