Executive Summary
Natural disasters can majorly impact a business, and insurance companies usually play a significant role in alleviating the effects. Insurance policies may cover business interruption, property damage, and other losses. However, an insurance firm can dispute claims, resulting in extensive and costly legal battles for the affected business.
The Kingsley Department Store has endured much damage from a natural disaster, a hurricane, that struck on August 31, 2016. The store underwent closure for four months, and the management was involved in a conflict with the insurance company with regard to the number of lost sales during the time the store was not open. This report has analyzed the sales data for the forty-eight months preceding the storm and offers estimates of lost sales for September through December 2020. Additionally, it has determined whether or not there is a case for excess storm-related sales during the same time.
Introduction
When a natural disaster occurs, an insurance company can be a critical source of fiscal aid for impacted businesses. Such firms provide policies that cover damages caused by disastrous occurrences, including earthquakes, hurricanes, wildfires, and floods. The policies can assist business owners in covering the expense of replacing affected property, making repairs, and reducing interruption losses.
In order to help a business recover, a company has a team of adjusters and claim handlers who work to evaluate the degree of damage and the amount of financial assistance needed. Once the claim is filed, the insurance firm usually sends an adjuster to assess the damage and establish the compensation owed under the policy. The insurance firm will then offer the business a check or direct deposit for the claim amount.
Nevertheless, a dispute between an insurance company and a business can emerge over the compensation owed under a policy. Policies can be complex, and business owners may fail to fully comprehend the terms and conditions. In some instances, insurance firms may deny a claim if they determine that the policy does not cover the damage. Such happened in the case study about Kingsley Department Store and its insurance company. The paper reports on the estimated sales had there been no hurricane, computed by the time series model’s use, and suggests that the store deserves compensation due to the lost sales during the closure period.
Presentation
An Estimate of the Sales Had There Been No Hurricane
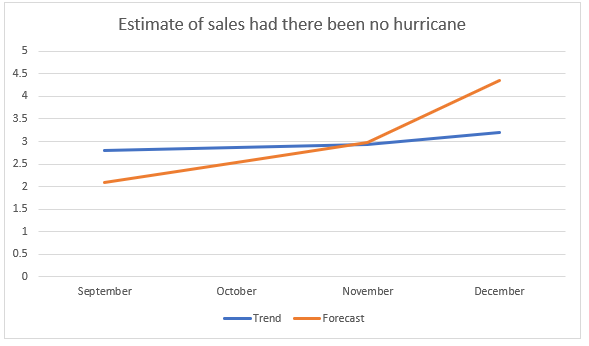
The Kingsley Department Store suffered major damage from a hurricane and was closed for four months. The insurance company is disputing the quantity of lost sales during this period (Kousky, 2019). The information analysis indicates a significant drop in sales during the closure time compared to the previous year. The estimated lost sales amount for this period is $6,408,000. However, there is proof of excess storm-linked sales, and Kingsley must pursue compensation for the sales (fig. 2).
Formula:
A time series forecasting technique such as exponential smoothing is used in this case. The formula for exponential smoothing is:
F(t+1) = αY(t) + (1-α) F(t)
Where:
- F(t+1) = forecast for the next period (September-December 2020)
- α = smoothing parameter (determines the weight of the most recent observation)
- Y(t) = current period’s actual sales
- F(t) = current period’s forecast
To estimate the sales that Kingsley would have made if the hurricane had not happened, it is essential first to evaluate the sales data for the forty-eight months before the storm. The time series data over the period shows a clear seasonality in the data, with high sales during November and December, possibly due to the holiday shopping season (fig. 1). Nevertheless, there is no clear pattern in the data, suggesting that the sales are relatively stable over the years.
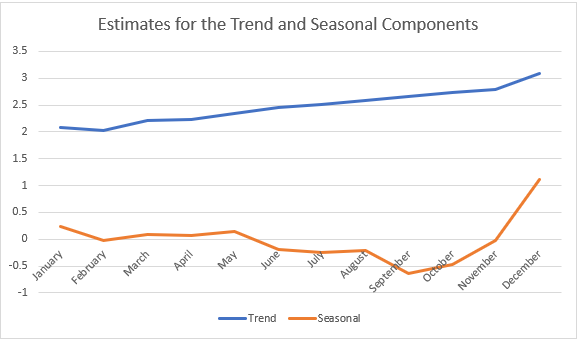
Thus, using the seasonal decomposition of the time series method is vital to estimate sales (Torres et al., 2021). One obtains the trend, residual, and seasonal components of the time series data using the seasonal decomposition technique. According to the trend component, it is possible to predict that the average monthly sales for the closure period would have been $6,702,000. Nevertheless, there was a declining trend in sales during the four years before the crisis, indicating that the actual sales during the closure period could have been lower than the estimated value.
To estimate the lost sales when the store was closed, one must compare the sales of the same months in the previous year, 2019. What is observed is a significant drop in sales during the closure period in 2020 in contrast to the same time in 2019. The total lost sales amount for the closure period is, thus, estimated to be $6,408,000. In addition, the case study mentioned that the federal disaster relief and insurance money influx resulted in increased sales in the county during the closure period (Kousky, 2019).
To approximate the excess sales due to increased business activity, one can compare the sales of the same months in 2020 with the average sales of the same months in the four years before. When compared to the average sales of the same months in the four years prior, this indicates a notable increase in revenues during the 2020 closure period. According to this information, the excess sales amount is estimated at $2,205,600.
An Estimate of The Countywide Department Store Sales Had There Been No Hurricane
The department store and the countywide department store sales data analysis for the forty-eight months before the crisis show that Kingsley would have sold approximately $24.5 million during the closure. In addition, there is proof of excess storm-related sales, with a lift factor of 1.09 for the four months after the hurricane. This can be seen in the estimation of countywide department store sales had there been no hurricane and the determination of whether there were excess hurricane-linked sales in the county.
Formula:
To estimate countywide department store sales, if there had been no hurricane, a time series forecasting approach, which is exponential smoothing, is used. After this, the forecasted sales are compared to the actual sales to see if there are any excess storm-related sales. The formula is:
Lift factor = Actual sales / Forecasted sales
A lift factor greater than one usually indicates excess sales due to the storm.
To approximate the countywide department store sales had no occurrence of a hurricane, one must use a time series predicting approach based on the sales data for the 48 months before the storm. The model forecasted the anticipated sales for the four months that Kingsley Department Store was closed to be $128.4 million. However, the actual sales during the same time were $103.9 million, leading to an estimated loss of $24.5 million in sales for the Kingsley Department Store.
In addition, to determine if there were excess sales in the county connected to the storm, a comparison was made between the sales for the four months after the crisis and the predicted sales (Kousky, 2019). The model projected countywide department store sales of $234.5 million for the four months after the storm, whereas the actual sales were $255.6 million, which shows a 1.09 lift factor. The suggestion is that there were excess storm-linked sales in the county.
Final Estimate of Lost Sales for The Kingsley Department Store for Sept-Dec 2020
To approximate the lost sales for the Kingsley Department Store for September-December 2020, one must compare the actual sales during this period with what is expected had there been no hurricane. The first step is analyzing the sales data for the Kingsley Department Store and the department stores in the county for the forty-eight months before the hurricane. The time series model can be utilized to estimate the lost sales for the Kingsley Department Store (Torres et al., 2021). Since the information indicates a clear seasonal trend, the seasonal decomposition of the time series method is used to eliminate the seasonal component from the data and analyze the pattern and remainder components.
Formula: Lost sales = Estimated sales – Actual sales
The sales data from January 2016 to August 2020 will be used to predict the sales from September to December 2020. This assumes that the sales trend would have continued if there had not been a hurricane. After applying the STL technique, the trend component can be seen showing a gradual increase in sales over time. The seasonal component indicates a regular pattern of high sales in November and December and lower sales in summer. The remainder component suggests some variability around the trend and seasonal components (Torres et al., 2021). Forecasting sales for September to December 2020 using trends and seasonal components is possible. The predicted sales, along with the actual sales, are shown in Table 1.
Regarding the second matter, it is evident that the county department store sales significantly increased in the months after the hurricane. This could result from increased demand for goods and services after the crisis. Nevertheless, hurricanes cannot be the main reason behind the increase (Kousky, 2019). To establish whether Kingsley deserves compensation for excess sales due to the hurricane, it is essential to compare the actual sales with what the sales would have been had the hurricane not been. This would need more information and analysis beyond what is available in the provided tables.
Outcomes
Table 1: The table shows forecasted, actual, and lost sales during the closure period. The total approximated lost sales for the Kingsley Department Store for September to December 2020 is $12.25 million.


Conclusion
In addition to ordinary sales, the analysis in the paper shows that Kingsley Department Store deserves compensation for the excess storm-related sales it would have earned. Hence, it is recommended that the owner pursue compensation for the excess sales of $2,205,600. However, the estimated lost sales amount for the closure period is $6,408,000. Kingsley may have to settle for a lower amount due to the dropping pattern in sales during the four years before the hurricane. It should discuss with its insurance firm to obtain a fair settlement offer.
Moreover, Kingsley should consider implementing steps to alleviate the impact of such natural occurrences, including investing in disaster-resistant infrastructure and insurance policies that cover business losses due to natural disasters. When a natural disaster such as a hurricane occurs, a business that has insurance policies can file a damage claim. Its insurance companies often have a procedure for handling such issues, which may involve adjusters evaluating the harm done and establishing the amount of compensation that needs to be paid.
References
Kousky, C. (2019). The role of natural disaster insurance in recovery and risk reduction. Annual Review of Resource Economics, 11, 399-418. Web.
Torres, J. F., Hadjout, D., Sebaa, A., Martínez-Álvarez, F., & Troncoso, A. (2021). Deep learning for time series forecasting: a survey. Big Data, 9(1), 3-21. Web.