Background
Frequency resolution refers to the ability of the ear to filter one particular sound frequency from other competing sound(s) occurring in different frequencies (Lutman & Wood 1985, p. 1). In most cases, the masking/competing sound may be presented in much higher intensities relative to the target sound without necessarily affecting the target sound’s audibility except in cases where the two sound frequencies are much closer (Lutman & Wood 1985, p. 1). Frequency resolution occurs on the basilar membrane of the auditory system (Cochlea) whereby each filter corresponds to a specific frequency on a specific position on the basilar membrane (Moore 2003; Sek et al. 2005, p. 408). Accordingly, Moore (1998) notes that sensorineural hearing losses occur when the functions of the cochlea are impaired, and therefore, the absolute sensitivity and frequency selectivity of the auditory system are subsequently reduced.
There are various methods for measuring frequency resolution such as frequency discrimination, psycho-acoustical tuning curves, determination of auditory filter shapes, and detection of frequency modulation among others (Larsby & Arlinger 1998, p. 4; Sek et al. 2005, p. 408). However, masking experiments such as the notched-noise method used for the determination of auditory filter shapes and the psycho-physical tuning curves (PTCs) for determining the level of masker (usually a narrowband noise) required to mask a sinusoidal target signal presented at a fixed frequency (usually fixed at a low sensation level, SL of about 10 dB) have been widely used in measuring frequency resolution (Moore et al. 2000, p. 205; Sek et al. 2005, p. 408). Additionally, Moore (2004) notes that some types of hearing losses in the cochlear may arise from the effect of inner hair cells (IHC) or neurons on the basilar membrane not functioning effectively. This effect warrants the development of additional psychoacoustic methods for diagnosing dead regions (regions whereby off-place tone detection occurs on the basilar membrane) in the cochlear relative to the off-frequency listening model (Moore 2004). The most common methods for detecting dead regions and their extent include the ‘Threshold-Equalizing Noise’ TEN (SPL) and TEN (HL) tests (Moore et al. 2000).
The significance of Measuring Frequency Resolution
As noted earlier, the complex sound that reaches the ear may be subject to competition from other sounds or noise, and thus, sound analysis in the cochlear is very important in responding to various changes and events (Larsby & Arlinger 1998, p. 3). Normally, accurate signal (sound) analysis in the cochlear entails assessment of variations in the intensity and frequency of the sounds to allow the ear to discriminate between frequency components occurring at close proximities (Larsby & Arlinger 1998, p. 3). Furthermore, impaired sound analysis, and thus, frequency resolution has been implicated in problems associated with the inability to understand speech by hearing-impaired persons especially in noisy places (Larsby & Arlinger 1998). For example, when a person’s auditory system experiences reduced spectral or temporal processing of sound elements, chances are high that the individual may fail to differentiate between various elements of speech, especially vowels and syllables (Larsby & Arlinger 1998, pp. 3-5).
According to Smoorenberg (1992), noise can induce hearing losses by as much as 10-15 dB HL, which in turn affects speech recognition to significant levels. Therefore, it is evident that there is a link between reduced sound analyses (frequency resolution) and poor speech recognition abilities in hearing-impaired persons particularly in noisy places (Larsby & Arlinger 1998, pp. 3-5).
The Proposed Method of measurement
Many techniques for measuring frequency resolution in the past few years have been complicated by the use of complex equipment, extensive subject training sessions, and long test times. However, building upon the psychoacoustic tuning curve (PTC) technique developed by Zwicker and Vogten in 1974, many researchers have designed simpler and fast methods for measuring frequency resolution. For instance, Sek et al. (2005) propose a fast technique for measuring psychophysical tuning curves (PTCs) for normal and hearing-impaired subjects. In this fast method, PTCs are measured using pure-tone signals (at a fixed frequency) and narrowband noise maskers (varying from minimum to maximum frequency) (Sek et al. 2005, p. 410). PTC measurement commences with the presentation of the target pure-tone signal (at a fixed frequency of about 10 dB SL), which is regularly pulsed to ensure that the subject pays attention to the signal (Sek et al. 2005, p. 410). Here, separate tone pulses last for a maximum of 500 ms with the rise/decay time lasting for 20 ms and the gap between two successive signal-pulses lasting for 200 ms (Sek et al. 2005, p. 410). Moreover, the centre frequency of the masker is set in such a way that it allows for a frequency sweep from minimum (about 1-1.5 octaves below the frequency of the target signal) to maximum for the forward sweep and vice versa for the reverse sweep, within a four minute period (Sek et al. 2005, pp. 408-420).
Measurement of the PTCs follows the same method used in Bekesy audiometry except that in the fast method, the level of the noise required to mask the target signal is a function of the centre frequency of the masker. Therefore, PTC measurement commences with administering several pulses of the target signal before turning on the maker signal (with a minimum or maximum centre frequency). Subsequently, the subject is asked to press the button if the signal is audible and to release it if the signal is inaudible. As the subject presses the button, the noise increases at a rate of 0.5-0.8 dB/s, and decreases at the same rate when the button is released.
The major advantage of the fast method is that it achieves the same results as the conventional methods of measuring frequency resolution, which are complex and time-consuming, within a short time. Additionally, the method has been tested on children aged 7-10 years, and the results show no significant difference with those obtained for adults. Therefore, this method is suitable for a wide range of clients including children and the elderly (Malicka, Munro & Baker 2009, p. 547). Conversely, the major disadvantage of this method is that it fails to account for the confounding factors such as age and the hearing threshold level (HTL), which can influence different aspects of frequency resolution especially among the elderly subjects (Lutman, Gatehouse & Worthington 1991, p. 320). Furthermore, the method requires additional technological equipment, which may also require further staff training before implementation. Besides, this method has not been made available to many clinicians, and thus, it may become difficult to implement.
Implementation
The proposed method for measuring PTCs to determine frequency resolution in subjects can be implemented using the existing standard audiometric equipment in the Audiology Department and new equipment. Here, to accomplish PTC measurement using the fast method, there is the need to develop a software program to support any clinical audiometer fitted with headphones and connected to a PC (Malicka, Munro & Baker 2009, p. 547). Basically, a digital-to-analogue converter is also needed to generate the signal and masker tones through separate channels. Moreover, low-pass filters with specific cut-off frequencies are also required for frequency selectivity before the signals are delivered to programmable attenuators, a summer, a headphone buffer, and finally to headphones with low frequency distortions and broadband frequency responses (Sek et al. 2005, p. 410; Malicka, Munro & Baker 2009, p. 547).
Interpretation of Results
Interpretation of the results for clinical purposes after using the fast method entails various statistical treatments and analyses. In a typical PTC (figure 1), the tip of the curve corresponds with the point where the level of the masker is lowest.
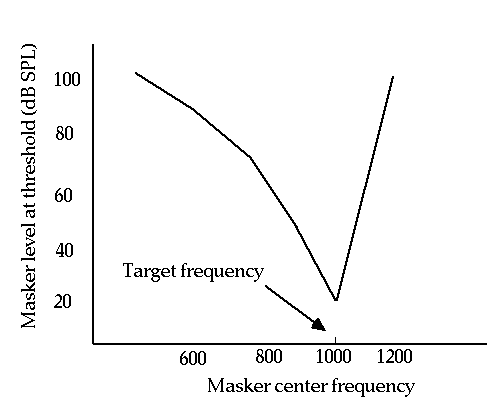
To visualize the tip, the PTCs require smoothing to allow for estimation of the tip frequency followed by the determination of the lowest level of the masker on the smoothed curves. Subsequently, linear regression analyses are performed to determine the point of intersection on the smoothed PTCs, which gives an estimate of the tip frequency (Sek et al. 2005). For a normally-hearing person, the tip frequency may be somewhere near 1020 Hz if the signal frequency is 1000 Hz as in figure 1 above. Additionally, the tip frequencies for the forward and reverse sweeps should be compared to distinguish between tip characteristics generated by normally-hearing subjects and hearing-impaired subjects. For comparison, if the masker bandwidth is set at 80 Hz and the rate of change is set at 2 dB/s, for normally-hearing subjects, the tip of the PTC will be somewhere above or below the signal frequency for the forward and reverse sweeps respectively (Sek et al. 2005, p. 413).
Conversely, to assess the impact of noise bandwidth on the shape of PTCs, bandwidths of 80-320 Hz can be used. Considering the signal frequency in figure 1 above (1000 Hz), research shows that the PTCs will become broader as the level of the noise increases (Sek et al. 2005, p. 414). Here, the notable characteristics of the PTCs such as the shape of the curve at the tip frequency are evaluated considering that, for hearing-impaired subjects, the shape of the tip may vary, and sometimes, it is a double-tipped PTC (Kluk & Moore 2005). Taking the above-mentioned parameters into consideration, the data analyzed provides useful insights into the defining characteristics of the edge frequencies associated with dead regions in hearing-impaired subjects (Sek et al. 2005, p. 417; Malicka, Munro & Baker 2009, p. 550). Therefore, these analyses can help the clinicians in the diagnosis of different aspects of sensorineural hearing impairment and the subsequent determination of the most appropriate hearing aids for their patients.
Recommendations
The fast-PTC measurement method proposed in the foregoing discussions has been tested for normally hearing and hearing-impaired subjects. Accordingly, this method is a useful clinical tool in the diagnosis of sensorineural hearing losses in normal to severe cases. Furthermore, this method will also be a valuable tool in the assessment of hearing problems among patients of different age-groups including the school-age children and the elderly. Overall, this method is both practicable and rapid, and thus, it is worth being implemented and evaluated for future improvement.
References
Kluk, K. & Moore, B.C.J. 2005. Factors affecting psychophysical tuning curves for hearing-impaired subjects. Hear Res, 200, pp. 115-131.
Larsby, B. & Arlinger, S. 1998. A method for evaluating temporal, spectral and combined temporal-spectral resolution of hearing. Scand Audiol., 27, pp. 3-12.
Lutman, M.E. & Wood, E.J. 1985. A simple clinical measure of frequency resolution. British Journal of Audiology, 19, pp. 1-8.
Lutman, M.E., Gatehouse, S. & Worthington, A.G. 1991. Frequency resolution as a function of hearing threshold level and age. J. Acoust. Soc. Am., 89(1), pp. 320 328.
Malicka, A.N., Munro, K.J. & Baker, R.J. 2009. Fast method for psychophysical tuning curve measurement in school-age children. International Journal of Audiology, 48, pp. 546-553.
Moore, B.C.J. 1998. Cochlear Hearing Loss. London: Whurr.
Moore, B.C.J. 2003. An introduction to the psychology of hearing. 5th ed. San Diego: Academic Press.
Moore, B.C.J. 2004. Dead regions in the cochlea: conceptual foundations, diagnosis and clinical applications. Ear Hear, 25, pp. 98-116.
Moore, B.C.J., Huss, M., Vickers, D.A., Glasberg, B.R. & Alcantara, J.L. 2000. A test for the diagnosis of dead regions in the cochlea. Br J Audiol, 34, pp. 205-224.
Sek, A., Alcantara, J., Moore, B.C.J., Kluk, K. & Wicher, A. 2005. Development of a fact method for determining psychophysical tuning curves. International Journal of Audiology, 44, pp. 408-420.
Smoorenberg, G.F. 1992. Speech-reception in quiet and in noisy conditions by individuals with noise-induced hearing loss in relation to their tone audiogram. J Acoust Soc Am., 91, pp. 421-37.