Introduction
This paper provides a financial analysis of GAP Inc., a well-known clothing retailer. The analysis is based on SEC resource data (Security and Exchange Commission, 2021; Security and Exchange Commission, 2023). An interpretation of trends over the past four years is proposed by evaluating indicators from income statements, balance sheets, and cash flow statements to analyze financial relationships. The four areas include liquidity, activity, profitability, and coverage; Appendix A contains all calculations carried out using the Excel software package.
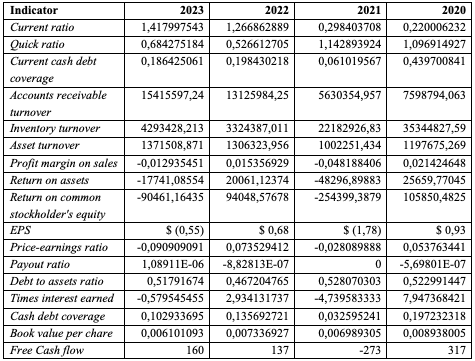
Liquidity
The capital structure of GAP Inc. is evolving toward greater debt, as evidenced by the rising share of total liabilities while shareholders’ equity remains dynamic. However, this fact does not threaten the company’s liquidity; on the contrary, current assets significantly exceed current liabilities, as seen in the current ratio in Table 1 (see Appendix). Moreover, this indicator has been growing over the past four years, but asset liquidity is partly declining, as shown by the quick ratio. The company does not provide a separate item in the balance sheet for accounts receivable, so the other current assets column was used to calculate it. At the same time, positive dynamics are also observed in current cash debt coverage, which, despite the low values of the numerator of this formula in the form of net cash from operating activities, the organization has noticeably few current liabilities, which makes its financial health stable in the short term.
Activity
Even though GAP Inc. is a clothing retailer with a relatively long product shelf life, which can signal high inventory levels, the company is quite effective in its activity ratios. The calculated values are incredibly high because net sales are high relative to the company’s assets and liabilities. Such a management model shows that the organization focuses on sales efficiency, bypassing the storage of many products in its sales strategy.
However, this applies to inventories; highly productive companies collect receivables. Even if this asset is only a part of other current assets, the ratio indicator will only increase. Finally, GAP Inc. generates profit growth every year. At the same time, assets, if they grow, are of a much smaller order, which is why all four years of positive dynamics are observed across all indicators of relations; this signal removes only potential liquidity risks that could have been identified in the previous chapter.
Profitability
However, the indicated high activity efficiency does not guarantee unconditional profit. The profit margin fluctuates around zero, indicating high operating and gross expenses. Since net profit often turns negative, return on assets also shows volatility. However, in 2022 and 2020, when it is positive, its indicator is quite significant, which is a consequence of the low number of assets outlined in the chapter above.
A similar situation is observed in return on shareholders’ equity, with even larger absolute values, since equity makes up a smaller part of the capital structure than debt. EPS reveals to investors a similar lack of profitability, which is also confirmed by the p/e ratio; however, the latter indicator also offers an opportunity for market share growth, as it is currently significantly below historical highs. Finally, the payout ratio is meager, so dividends were not paid in 2021 due to high operating expenses.
Coverage
At the same time, the company’s total debt is only half its assets, which, as noted above, are extremely small relative to earnings. In addition, cash debt coverage remains stable at 0.1-0.2, which is good, as the company has primarily liquid assets to cover its debt. Book value per share is lower than the fair price of shares, which will be a limiting factor for growth in the investor market, given the low P/E ratio.
Times earned interest repeats the dynamics of negative and positive values of similar indicators related to the net profit above. At the same time, the dynamics are downward, underscoring the unrealized potential of high operating expenses. However, GAP Inc. will correct the situation in free cash flow by 2023, after negative dynamics in 2021, which could result from COVID-19 restrictions and a refocus on online sales.
Conclusion
GAP Inc. has low assets and liabilities and relies on debt financing; however, the company’s financial health is more than comfortable in the short and long term. Liquidity and solvency are high, annual profit growth is recorded, and activity ratios are incredibly high. However, the company’s efficiency does not allow it to receive high net profit, which is why net profit and net cash flow from operating activities are involved in most of the analyzed ratios. As a result, the unique structure of the financial strategy with a careful approach to debt by management makes it possible to continue operations, year after year, faced with negative net profit, which is a contradictory sign for investors, but, given the experience and strength of the GAP Inc brand, keeps the company among the leaders in the market industry.
References
Security and Exchange Commission. (2021). GAP Inc 10-K Annual Report 2021.
Security and Exchange Commission. (2023). GAP Inc 10-K Annual Report 2023.
Appendix
Table 1 – GAP Financial Ratios