Introduction
PDA Sim produces three products (Hand Held X5, Hand Held X6 and Hand Held X7) and desires to come up with a strategic decision about which product to be discontinued from production in the year 2006. The three products are at different stages in the market and an appropriate decision about continuing production of any of the three products is required. In this paper, I will carry out Cost-Volume-Profit analysis for PDA Sim by calculating the contribution margin for products: Hand-Held X5, Hand Held X6, and Hand Held X7 in the year 2004 and 2005. The analysis will help make a decision to continue the production of any of the three products.
CVP analysis
According to Quintana (2002) CVP analysis is a tool used by managers to determine the relationship between costs, volume, and profit that is made by an organization. This tool uses elements such as prices, sales volume, unit variable costs, fixed costs, and the product mix of an organization. CVP analysis is applied in making decisions such as the products to be manufactured in a specific time period, the policy to be adapted to price products, and the type of equipment to be acquired by an organization. The break-even point is used to determine profitable sales capacity. At the break-even point, a company makes neither profits nor losses (Quintana, 2002).
According to Accounting Management (2009, pg. 1) “contribution margin is the amount remaining from sales revenue after variable expenses have been deducted. Thus it is the amount available to cover fixed expenses and then to provide profits for the period.” The contribution margins for PDA Sim vary by great margins in the years 2005 and 2004 for the three Hand Held products. Contribution margins for these products help develop decisions about which product should be discontinued from the production system.
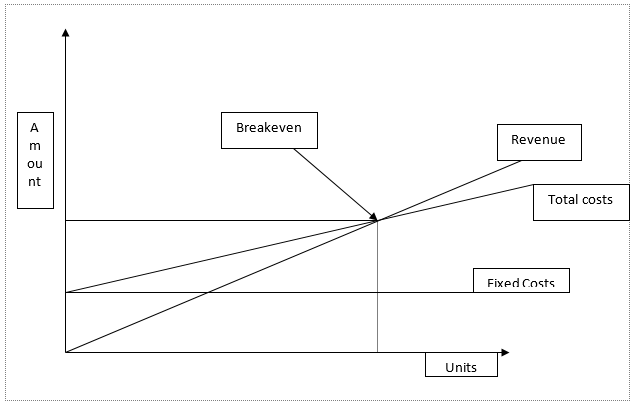
From the above diagram, it is evident that a company should operate above the break-even point in order to make profits. For a company to make profits, the total costs curve should be below the revenue curve. A loss is made when the revenue curve is below the total costs curve. The diagram helps summarize the CVP framework for a clear graphical analysis.
Handheld X5
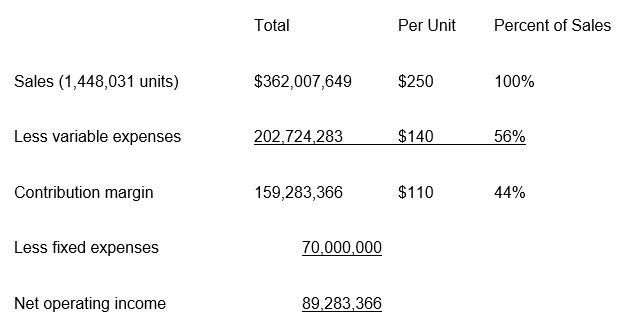
X5 Financials for 2005
Source: Forio (2009).
Contribution margin for Handheld X5
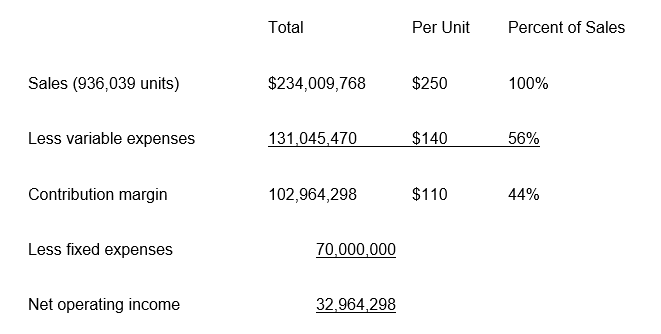
Year 2005
Year 2004
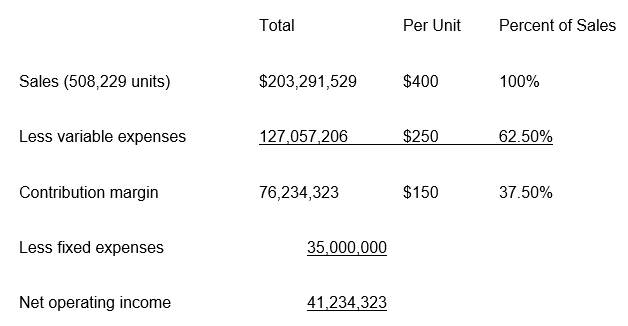
Hand held X6
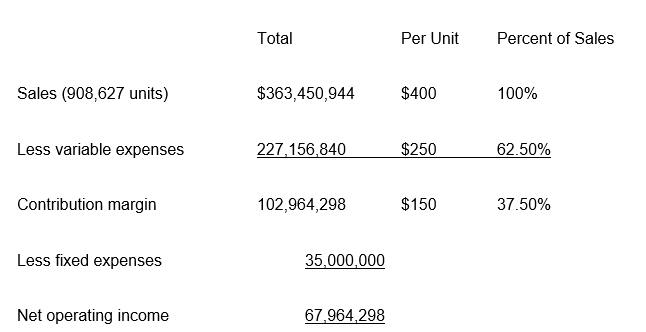
X6 Financials for 2005.
Source: Forio (2009).
Contribution margin for Handheld X6.
Year 2005
Year 2004
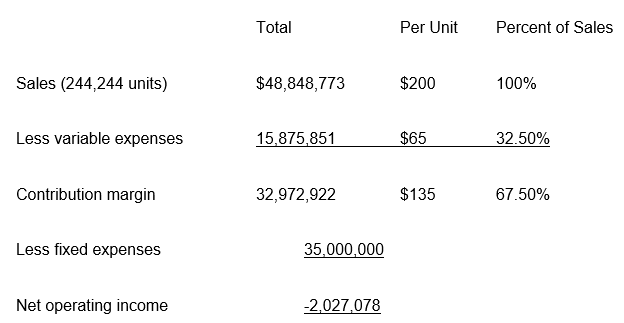
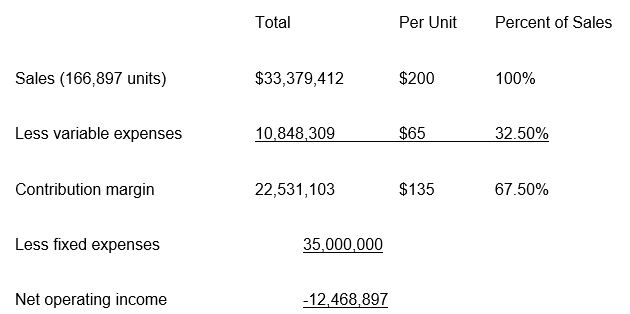
Handheld X7
X7 Financials for 2005.
Source: Forio (2009).
Contribution margin for handheld X7.
Year 2005
Year 2004
From the above computations, it is evident that Hand Held X5 has a contribution margin of 159,283,366 which is 44 percent of the total sales made by the company in 2005. In 2004 the company made a contribution margin of 102,964,298, which is 44 percent of the total sales. The net operating income of the company has been found to be 89,283,366 for the year 2005 and 32,964,298 for the year 2004.
Hand-Held X6 had a contribution of 102,964,298, which is 37.50 percent of the total sales in the year 2005 while in the year 2004 the company made a contribution margin of 76,234,323. The net operating income for the year 2005 was 67,964,298 while in the year 2004 the company made an operating income of 41,234,323. Hand-Held X7 the company had a contribution margin of 32,972,922 in the year 2005 while in 2004 the company had a contribution margin of 22,531,103. The net operating income of the company in the year 2005 was -2,027,078 while in the year 2004 the operating income was -12,468,897.
It is clear that from the above analysis, Hand Held X7 has a negative net operating income for the year 2005 and the year 2004. The management of PID Sim should discontinue this product from production since costs exceed the sales revenues. For the two years the product has been in the market only losses have been registered. This is clear evidence that the management should consider discontinuation of the product since there are no benefits generated from the production system for this product.
Hand-Held X6 and Hand Held X7 have a positive net operating income. This indicates that the two products are operating above the break-even point. Since the two products are generating profits for the company, the management should continue the production of Hand-Held X6 and Hand Held X7. In summary, any product that has a negative operating income should be discontinued from the production system since the costs incurred by the company be more than the generated revenues.
References
Accounting management (2009). Cost Volume Profit Relationship – (CVP Analysis). Web.
Forio (2009). PDA Sim. Web.
Quintana, O. (2002). Cost-Volume-Profit Analysis. Web.