Graphical Representation of Healthcare Data
A healthcare organization must collect data about different processes that occur in the facility. Such information should be continuously monitored to analyze any patterns that deserve special attention, whether to maintain or improve a certain operation. Graph 1 below represents data on several parameters examined for the month of March in different hospitals within the Western Healthcare System (WHS) (Shaw & Carter, 2019). The findings, based on information gathered within the WHS establishment, demonstrate the need for advancement in various areas that do not correspond with quality criteria.
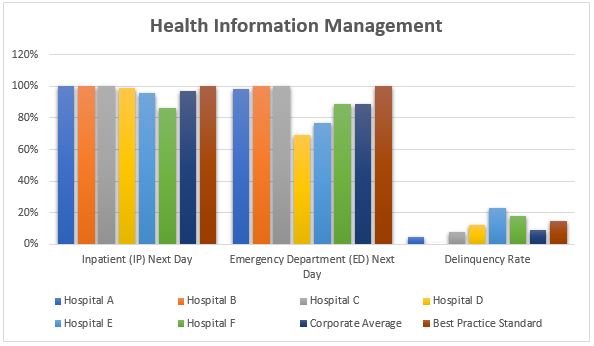
Three data elements were chosen to assess the performance of hospitals within WHS. First, inpatient parameters for the next were examined, with the corporate average (CA) being 97% in comparison to the best-practice standard (BPS) being 100%. Second, information concerning the emergency department for the next day was observed, with CA of 98% and BPS of 100% (Shaw & Carter, 2019). Notably, such elements concern charts that were received and do not account for other factors such as scan or index days.
While it is crucial to analyze the remaining elements, it is also essential to view what data is accessible to ensure that other parameters are trustworthy. Furthermore, the third component that was assessed is the delinquency rate, in which CA and BPS are 9% and below 15%, respectively (Shaw & Carter, 2019). The gathered information is insightful for understanding how WHS hospitals operate.
Managerial Evaluation of the Dashboard Report
If I were WHS’s corporate health information management director, my overall evaluation of the dashboard report would be moderately acceptable, with the exception of three establishments. In particular, hospitals that do not meet several BPSs of the selected parameters, although in varying degrees, are D, E, and F. For example, as can be seen from Graph 1, hospital E is below BPS for all of the three elements, with especially concerning patterns for the emergency department and delinquency rate (Shaw & Carter, 2019). Therefore, there is room for improvement for organizations within WHS.
Additional Information to Request
Some additional data may be insightful in determining why some hospitals fall behind others in performance. For instance, the delinquency rate is associated with inpatient health records and medical staff (Shaw & Carter, 2019). Accordingly, it may be beneficial to analyze, for instance, the situation with the available workforce in each WHS establishment. Data on such a matter may demonstrate whether there is a shortage of employees and potentially reveal greater concerns within facilities like Hospitals E and F. Therefore, a further investigation is likely required to identify exactly what and how should be advanced.
Determining Trends
In addition to the assessed components, several metrics reveal some concerning trends. CA for inpatient and outpatient scan days do not correspond with BPSs for WHS. For example, when considering the former parameter, only two of the six hospitals have met their BPS (Shaw & Carter, 2019). Such a tendency must be analyzed further since any deviation from BPS, whether an increase or decrease, should receive closer attention. BPSs are provided for healthcare organizations to follow as quality criteria, and substantial distinctions from such standards should be investigated to determine potential areas for enhancement or unexplored practices.
Reference
Shaw, P., & Carter, D. (2019). Quality and performance improvement in healthcare (7th ed.). American Health Information Management Association.