In the article ‘Mapping Students’ Decision-Making Process across University Ranking Parameters: A Quantitative Study’, Sharma et al. (2020) implemented one-way ANOVA to indicate the difference between five parameters of the National Institutional Ranking framework. Analysis of variance or ANOVA is one of the most common statistical research methods that implement F statistics (Kim, 2017). ANOVA’s main specialization is the analysis of the difference in variances (Kim, 2017). So, the implementation of this method in providing data for the given quotative research is reasonable. Along with one-way repeated ANOVA measures, Sharma et al. (2020) apply posthoc Bonferroni comparisons, t-tests, and descriptive statistics for statistical analysis.
Moreover, to record information about students’ knowledge and expectations about higher education, Sharma et al. (2020) divided them into Section A and Section B. Data in Section A measured the preferences of students based on international exposure (Sharma et al., 2020). On the other hand, the dataset in section B assessed 23 additional factors, including infrastructure facilities, sports activities, student activities, and so on (Sharma et al., 2020). One-way ANOVA was implemented to determine if any of these 23 factors have significant variations. In a result, one-way measure ANOVA revealed a considerable difference between the compartmentalization of the 23 specifications determined by research with the five parameters of NRF (Sharma et al., 2020). Parameters such as public and peer perception, the geographical location of the institutions, and campus safety becomes the most crucial parameters for the students.
In analyzing 23 parametric samples, Sharma et al. (2020) separated them according to the source of variations (between groups and within-group). Moreover, they calculated several statistical parameters, namely the sum of squares, degrees of freedom, mean squares, calculated F statistics, and critical F value represented in the table (Sharma et al., 2020). This method is the most convenient in producing differentiable data (Ross & Willson, 2017). Although it is complicated to hold complex calculations, using ANOVA combined with other methods is the best option for observing qualitative data. Kim (2017) states that visualization of the data and values such as the mean, median, and mode of each group is necessary.
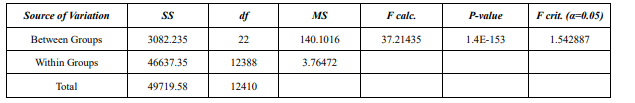
As shown in Table 1, the representation of the groups used in ANOVA analysis represented the highest significance of the F-value at a=0.05 (Sharma et al.,2020). Subsequent 256 posthoc tests and a Bonfeeroni analysis edited a value of 0.000197628 (Sharma et al., 2020). Moreover, the total sum of squares in two categories, including between groups and within groups, was 49719.58. Additionally, the cumulative sum of the degree of freedom was 12410 (Sharma et al., 2020). The sample of data was then used to represent the significance for 256 post-hoc Bonferroni comparisons (Sharma et al.,2020). The selected methods of cooperation with ANOVA were used for the relevant reason. Despite common belief, ANOVA is not always available for implementation in combination with some methods (Kim, 2017). Furthermore, Kim (2017) declares that the illustrations provided by ANOVA may have some errors, as the developer is a non-statistician. Sharma et al. (2020) do not highlight the effect size in their analysis.
To conclude, it could be said that ANOVA was suitable for this research and sample. By indicating 23 parameters and comparing them to each other, ANOVA provided the statistical framework for analysis. A successful combination of methods such as Bonferroni comparisons, t-tests, and descriptive statistics helped to achieve a precise result.
References
Kim, T. K. (2017). Understanding one-way ANOVA using conceptual figures. Korean journal of Anesthesiology, 70(1), 22.
Ross, A., & Willson, V. L. (2017). One-way ANOVA. In Basic and advanced statistical tests (pp. 21-24). Brill Sense.
Sharma, R., Divi, S., Patel, K., & Narayanan, N. (2020). Mapping students’ decision-making process across university ranking parameters: A Quantitative Study. Universal Journal of Educational Research, 8(12A), 7755–7765.