Scope
The Music Journey (MJ) initiative includes the development of a particular SH widget that partners can incorporate on their web pages. Broadly speaking, the realization of this project can be divided into two parts: technical and organizational. From a technical perspective, the development of widget software generally includes the following five stages: intake, design, development, launch, and support (Widgets, 2022).
The intake stage can be considered the scoping stage, primarily focusing on the widget. It implies investigating what is expected and how it can be made to fit its purpose. According to Markou et al. (2022), the widget serves the purpose of providing customers with an opportunity to view the events and their associated attendance prices for the musician they are currently listening to. Additionally, it should provide the convenience of accessing the SH payment service from partner web pages to simplify the purchasing process.
The following stage concerns developing the widget’s design in accordance with current technology and user experience. In short, it involves creating mock-ups, validating potential interfaces and their behavior, determining the need for user or administrator settings, and providing a cost estimate. These first two stages can be considered preparatory, after which the actual widget development starts. According to the case study, the desired project development approach is agile (Markou et al., 2022).
Therefore, widget coding will occur in iterative cycles, each of which will include the validation of data and security feasibility, as well as testing of the widget with potential scope and budget adjustments. Arcos-Medina and Mauricio (2019) define the steps of an agile project management approach as initiation, production, delivery, and optional refactoring. These steps can be considered in alignment with the intake, design, development, and launch stages of a software widget’s general development.
Once it is confirmed that the widget meets all established expectations, the final product will be deployed on the partners’ web pages and integrated into the SH brand. Afterward, there will be a need to maintain the widget’s smooth operation on all web pages involved. In the context of MJ, the technical phase includes an additional stage of adjusting the widget to accommodate the technology of future partners. Since SH intends to expand partnerships within the MJ framework, the device may need to be tailored to specific applications.
Before the development stage, the technical aspect of the project was closely intertwined with the organizational objective. Namely, the latter implies establishing the initial partnership and searching for new partners interested in implementing the SH widget. As mentioned in the case study, the MJ’s product manager intends to start working with two or three partners and anticipates involving three additional partners by the end of 2019 (Markou et al., 2022).
Assuming that every partner has its own technological and design requirements, other development cycles might be required. However, given that it is challenging to accurately calculate the project timeline if the number of interested partners continues to grow, the partnerships established in 2020 are considered outside the scope of the project and require the allocation of external resources. Nevertheless, the project does not contain specific information regarding partners’ technology requirements, selection criteria, detailed performance evaluation data, and widget settings.
Quality
During project management, quality can be measured at different levels. As Anantatmula (2020) states, these levels can be categorized into quality planning about project outcomes and project management processes. In particular, the former refers to the project manager and the team responsible for conducting quality assurance and quality control, which are established during the planning phase and executed during implementation. Meanwhile, the latter represents a form of administrative supervision over the project’s development based on the organization’s knowledge and experience (Anantatmula, 2020).
From this point forward, the current report will focus on quality planning related to project outcomes. While developing the MJ proposal, its project manager followed several average values to calculate its feasibility and financial outcome. Firstly, approximately 15% of partners’ website users will likely decide to click on the SH widget. Secondly, one-tenth of those users finalized the ticket purchase, indicating a 1.5% average conversion rate (Markou et al., 2022).
Finally, the average order value was $240, multiplied by the expected number of partners, which equals six. Therefore, the base quality metrics of 15% clicks and a 1.5% conversion rate on six web pages yield the expected performance metrics range of 12-16% clicks, 1.2-1.6% conversion rates, and 2-8 involved partners (Markou et al., 2022). Consequently, regular quality assurance and specific quality control measures will ensure that the project remains within these metrics.
Given the cyclical nature of project development, overall quality management must be conducted using specific tools for each stage of the agile development cycle. During the initiation step, quality standards can be visualized using charts, such as PERT or flowcharts. Alternatively, the Design of Experiments model can be used to lay the groundwork for efficient widget development. Lastly, the Music Customer Journey presented by Markou et al. (2022) can be used in conjunction with the Kano customer satisfaction model to inform design and functionality decisions (Arcos-Medina & Mauricio, 2019).
The production step involves a greater variety of qualitative tools. For instance, a Gantt Chart should be considered an essential component within the project’s framework. It enables the visualization of all project stages, incorporating a timeline and sequence of events to provide a comprehensive qualitative overview (Arcos-Medina & Mauricio, 2019). Apart from that, the quality function deployment matrix is also suitable for monitoring adherence to quality standards, utilizing an eight-discipline problem-solving model to aid in addressing potential issues.
When it comes to delivering the final product, its distinctive features have to undergo sophisticated quality control. In this regard, traditional methods such as checklists and control charts can be supplemented by FMEA and SMART matrices to ensure that the delivery meets all necessary criteria (Arcos-Medina & Mauricio, 2019). If there is a need to initiate the refactoring step, the qualitative tools must provide a suitable environment for comparison and analysis. Therefore, approaches such as the decision matrix, Histograms, and Success and Effect diagrams will be the most fitting for this purpose.
Cost
In estimating the project’s cost, two main variables must be considered. First, there is a need to allocate resources for the project, including personnel and equipment (Anantatmula, 2020). In this context, the case study provides sufficient information regarding the SH’s available human resources. According to Markou et al. (2022), the MJ project will require the collaboration of software designers, front-end engineers, back-end engineers, and data engineers, with the latter two combined into a single group. Second, there is a need to estimate the time required to complete the project (Anantatmula, 2020).
The case study measures time in-person sprints (PS); each PS equals two weeks of working time. Consequently, the project requires 20 PS for software designers, 20 PS for front-end engineers, and 40 PS for back-end and data engineers (Markou et al., 2022). Based on the information regarding the average salaries for the mentioned positions and the required work time, the project will cost SH $72,378, $100,526.80, and $201,391.24, respectively, yielding a total of $374,296.04 in human resource costs.
Time
There are two potential methods for estimating the optimal completion time of a project. According to the MJ project manager, the widget’s development is not complex, requiring only a single software designer, front- and back-end engineers, and a data engineer. The implication of this is that widget development will require 40 weeks of designer work, 40 weeks of front-end engineer work, and 40 weeks of back-end engineer and data engineer work. However, widget development is only part of the project (Markou et al., 2022).
The SH executive management intends to start working on the project in late November, develop the initial design during December, and begin coding in January (Markou et al., 2022). Given that one month roughly equals four weeks, the initiation step of the MJ project management will take five weeks. Thus, the total time necessary to complete the project is approximately 45 weeks in the case of involving a single worker from each of the mentioned positions.
On the contrary, the second option implies utilizing SH’s human resources to their full extent. According to the case study, SH employs eight software designers, five front-end engineers, and six back-end and data engineers (Markou et al., 2022). Consequently, the time necessary for the tasks associated with these positions will be reduced to five, eight, and 13.33 weeks, respectively.
As a result, the overall project time requirement will be 18.33 weeks, which is more than two times as efficient as the first option. It is known that SH executive management intends for the project to last from three to nine months (Markou et al., 2022). Given that the first option exceeds the project’s time frame and involves only one employee, the second option, which involves the entire SH workforce, is a better choice in terms of productivity.
Overall, the risk level of the MJ project can be considered low. Specifically, the lower level of risk derives from its comparison with the two other proposed projects. For instance, MJ’s initial revenue estimates are the lowest compared with Cart and DC initiatives. As Markou et al. (2022) state, the cart project is projected to generate $78,800,000 in revenue and $315,000,000 in gross merchandise sales (GMS). Meanwhile, revenue projections for the DC project constitute $204,000,000 GMS in the best-case scenario (Markou et al., 2022).
Conversely, the MJ project estimates $122,880,000 GMS in its strong prediction, which is roughly one-third of Cart and only half of DC. The greater projected GMS and revenues, however, are influenced by the amount of risk involved in other projects. In terms of the Cart project, there is an apparent ambiguity directly related to its central idea: the decision of whether to allow the “hold” option on tickets (Markou et al., 2022). Additionally, the value of the VIP components of the project is also questionable, as they provide no guarantee for the service in question.
When it comes to DC, the ambiguity surrounding the proposal is lower than in Cart. Its main issues, however, lie in the places it intends to connect with consumers. According to Feng and Xie (2019), the ad-consumer association plays a critical role in an ad’s success. The authors’ study of earlier advertising and marketing literature revealed that a successful advertisement has to connect with the target audience (Feng & Xie, 2019).
Additionally, it must make it easy for customers to relate to the circumstances depicted in the advertisement. This way, it activates several cognitive processes in consumers’ heads that remain unaffected. Due to the depth and complexity of the conceptual frameworks related to consumers’ self-perceptions, self-relevant material draws voluntarily focused attention and encourages cognitive elaboration (Feng & Xie, 2019). The DC project aims to place SH ads in every possible location, provided there is at least a slight connection to the subject.
This way, DC can allow SH to reach an enormous number of consumers. For example, they would receive ads while “shopping for shoes or housewares, watching video content, or using apps on the phone” (Markou et al., 2022, p. 6). Nevertheless, this is where the ambiguity comes into play: consumers may neither have the desire nor the willingness to be presented with an ad during some of those activities.
That is, based on the example provided in the case study, buying sportswear does not necessarily imply that the consumer intends to attend sports events (Markou et al., 2022). In other words, the DC way of advertising lacks relevance when compared with MJ. The ads issued under the DC initiative have a lower chance of triggering self-relevant concepts within consumers’ minds, making them less reliable.
In this context, MJ projects represent the type of project commonly referred to as “low risk, low reward.” It shares similarities with the Cart project in that it serves as a bonus on top of the expected service. However, its implementation is far more straightforward and does not bear the risk of service guarantee absence. MJ also shares similarities with DC in its intended operation, placing ads on partners’ web pages to illustrate the availability and accessibility of events associated with the service.
Nevertheless, its focus is narrower; MJ informs music consumers regarding their favorite musicians. While people might not desire to be disturbed by an ad when they shop for clothes, there is a far less perceived annoyance in seeing an opportunity to experience their favorite music live. Consequently, although the projected revenue and GMS are lower, so are the associated risk levels, resulting in MJ’s higher stability.
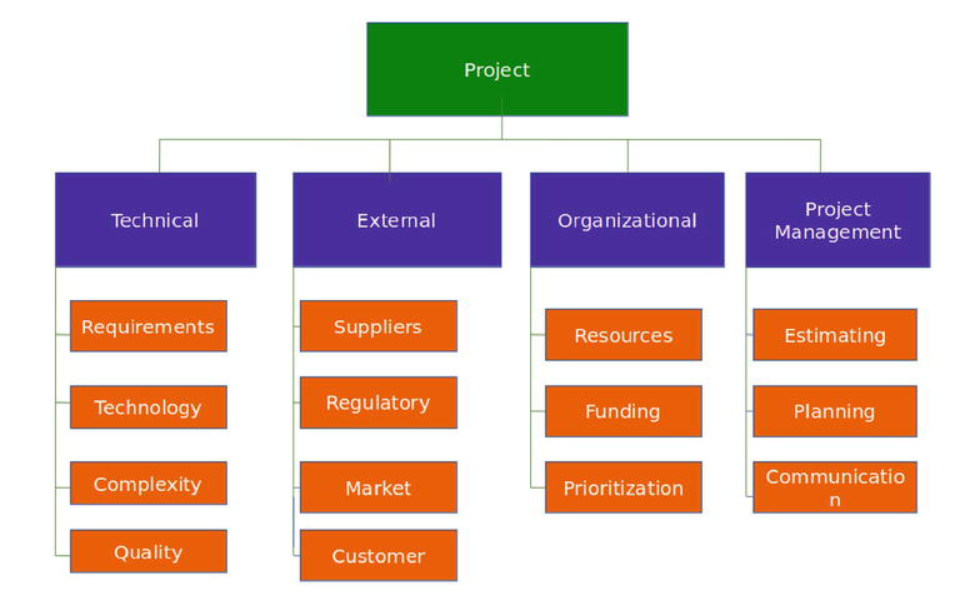
Understandably, the MJ project is not entirely risk-free, as some mild risks remain present in project development. Anantatmula (2020) divides these risks into four main categories: technical, external, organizational, and project management (Figure 1). In the former category, the most significant risk MJ development might face is poor product quality. However, it can be easily mitigated with sufficient quality planning, assurance, and control, as explained in one of the sections above.
The next category proves to be the least probable to pose any risk for the project, such as MJ. For instance, the government might decide to issue a regulation affecting ad content or distribution. Otherwise, the competitors might launch similar or better projects. If that is the case, SH will be able to absorb the damage caused by potential problems due to the low project cost and complexity.
In terms of organizational risks, the problems caused by resource allocation, funding, or task prioritization only result in project development prolongation, which is also manageable. Finally, project management risks, including potentially poor estimating, planning, and communication, are similar to the previous risk category. In other words, they can only prolong the project development, incur insignificant cost increases, and, thus, can be absorbed as well.
Location
The MJ’s project location can be derived from its nature: the development of the branded widget. From a technical perspective, it implies incorporating SH’s own human resources and coding environments to create a universally applicable script that requires only slight adjustments based on the partners’ platforms. Even when adjusting the widget for a particular partner, the process does not have to be transferred or outsourced.
According to Shaw (2022), scripts are designed to automate their execution. Specifically, they place the responsibility of code execution on the environment for which it was created, meaning that for SH, it is sufficient to know the partners’ technology type to develop the widget accurately. Thus, the project will be located at its own facilities within the SH office, as it will have a dedicated environment and access to essential human resources.
Contribution Report
In this report, I personally contributed to the description of project costs and time. When it came to describing costs, the information presented in the case study only yielded details on the human resources involved in the project. In this context, I had to search for information concerning the average pay that particular job positions receive. Thankfully, Salary.com (2023) had information on each class mentioned in the project: software designers, front-end engineers, and back-end and data engineers.

Software Designers
The time unit chosen for the project is a period of two weeks, referred to as PS. Consequently, the yearly average salary had to be divided several times to obtain the desired value. There are 12 months a year, and roughly four weeks in each month. Thus, the approximate pay a software designer would receive at SH is $86,854 / 12 / 4 = $1,809.46. Next, this value had to be multiplied by the expected number of weeks necessary for the project’s completion. Based on these calculations, the overall cost of designers’ work at SH is $1,809.46 * 40 = $72,378.4.
Front- and Back-End, and Data Engineers
Following the same logic, I calculated the cost of involving front-end, back-end, and data engineers in the MJ project. Since the case study grouped back-end and data engineers, I did not search for the salary ranges of data engineers, using only the information on back-end engineers. The calculations yielded the following results: the work cost for front-end engineers is $100,526.80; the work cost for back-end and data engineers is $201,391.24. Then, by combining the three results, I obtained the total cost of human resources for MJ: $374,296.04.
In this context, there is one crucial notion: SH utilizes an agile approach to project management. It implies the iterative cycle of development, which makes accurate time prediction difficult due to potential project prolongation. Anantatmula (2020) mentioned that calculating the cost rate per time unit can be beneficial in such situations, as it allows one to operatively evaluate the approximate cost of the prolongation. Consequently, assuming all three teams of software developers must work simultaneously, the total cost per time unit will be the sum of their respective weekly salaries. Then, to obtain the PS-based value, I divided the result by two. Therefore, the total cost rate per week, based on time units, is $2,518.02 + $2,513.17 + $1,809.46 = $6,840.65. In turn, the actual cost rate per PS-based time unit is $6,840.65 / 2 = $3,420.32.
In the meantime, for the time section of the report to be more understandable, the inclusion of a Gantt Chart is essential. There are many environments in which the chart can be constructed; however, I chose the online version available at Online Gantt due to its simplicity of use. The principal value that a Gantt Chart requires is time ranges for the project development steps.
In this context, the PS requirements for each specific team of developers proved to be helpful. The number of weeks necessary for software designers, front-end engineers, and back-end and data engineers is 5, 8, and 13.33 weeks, respectively. However, since engineers start their work simultaneously, only the better value of the two should be added to the total project time. As a result, the MJ project’s development is expected to last approximately 18.33 weeks, considering only working days.
Reference List
Arcos-Medina, G. and Mauricio, D. (2019) ‘Aspects of software quality applied to the process of agile software development: a systematic literature review’, International Journal of system assurance engineering and management, 10(5), pp. 867–897.
Anantatmula, V. (2020) ‘Project management concepts’, in Petrillo, A. et al. (eds.) Operations management, London: IntechOpen, pp. 215–231.
Feng, Y. and Xie, Q. (2019) ‘Ad creativity via augmented reality technology in online video ads: The differential role of novelty, message usefulness, and ad-consumer association’, Journal of promotion management, 25(6), pp. 907–933.
Widgets (2022) ichicraft Boards. Ichicraft.
Free Online Gantt Chart Software (no date).
Markou, P., Chao, R. O. and Goldberg, R. (2022) ‘Product development at StubHub: Don’t stop believin’. Darden Case No. UVA-OM-1705, SSRN.
Salary.com (no date) Salary research and career advice, Salary.com.
Shaw, M. (2022) ‘Myths and mythconceptions: What does it mean to be a programming language, anyhow? (keynote)’, in Companion Proceedings of the 2022 ACM SIGPLAN International Conference on Systems, Programming, Languages, and Applications: Software for Humanity. New York: ACM.