Introduction
Light has wave–particle duality, so on the electromagnetic spectrum, different wavelengths of light have different energy, frequency, and properties. In the range from about 400 to 800 nm of this spectrum is visible light: consequently, most electromagnetic waves are not perceptible to the human eye. The visible spectrum represents all the wavelengths produced by the dispersion of white light, which can be reflected by matter particles, giving it a corresponding coloring. For example, the leaves of plants are good at absorbing the red and blue portions of visible light but deflecting green, which is why most plants have green leaves.
Based on the study of absorbed and reflected light, spectrophotometric methods of analyzing substances work. When substances are irradiated with electromagnetic waves of visible light, a unique absorbance peak is created for each compound, where the substances absorb the maximum amount of light.
This lab work investigated the principle of Beer’s Law, which determines the molar absorptivity unique to each substance. The virtual laboratory work was performed to determine the wavelength of maximum absorption for nickel(II) chloride and identify the molar absorptivity from a standard curve. The curve was constructed by measuring the absorbance of nickel(II) chloride in a virtual spectrophotometer at various concentration values at the previously detected wavelength (Dotzert, 2022). The construction of the curve allowed, however, not only the determination of molar absorptivity but also the prediction of absorbance or concentration values from known data.
Purpose and Hypotheses
The purpose of the present work was a practical study of spectrophotometric analysis methods, the empirical determination of the absorptivity peak for nickel(II) chloride, the construction of a standard curve, and the use of the best-fit line equation to predict values. The main hypotheses of this laboratory work were, first, that it is possible to empirically determine the absorbance peak for a substance, and second, that as the substance concentration increases, the absorbance will increase linearly.
Data
Based on the measured absorptivities at various wavelengths, a wavelength dependence plot of absorbance was plotted for nickel(II) chloride (see Figure 1). A closer examination of the peak absorbance (see Figure 2) determined that the wavelength of maximum absorbance was 435 nm. This wavelength was used in further stages of the work to measure absorbances at different concentrations.
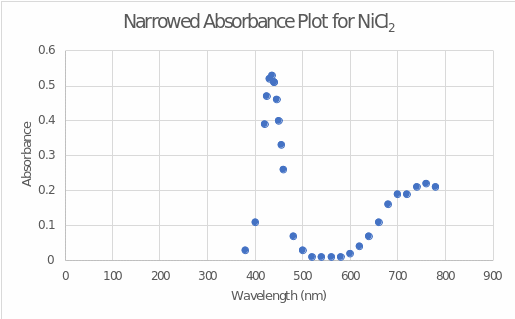
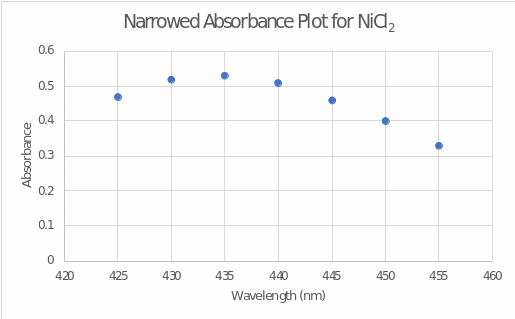
Figure 3 shows the concentration dependence of absorbance for nickel(II) chloride measured at 435 nm. Table 1 presents an example of six random points for absorbance that were measured at different concentrations. The graph presents a regression line equation fitting Beer’s law: y = 0.0053x – 0.0002. Although the x-intercept value should be zero, a non-zero value of the equation can be considered a statistical error. The coefficient of determination (R2) reports a perfect fit between the regression line and the set of points because it indicates that 100% of the variance of the variables is covered (Turney, 2022).
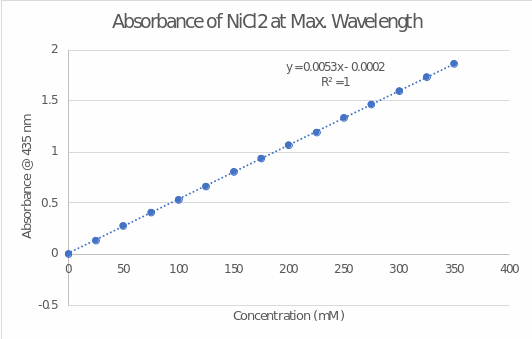
Table 1 — Absorption data as a function of nickel(II) chloride concentration (a fragment of the original table)
The equation shows that the slope of the graph is 0.0053, which is equivalent to the expression ϵ ∙ b in Beer’s law (Wenzel, 2023). Given that the diameter of the cuvette was 1 cm, the molar absorptivity was 0.0053 mM-1.cm-1 or 0.0053 L. mmol-1.cm-1.
Additional Assignments
When the standard curve was ready, the regression line equation could be used to calculate concentration or absorptivity. Table 2 shows the gaps in the values for cases b, c, and d: concentration only or absorbance only was given. Using a regression line solves these problems and determines the values sought. Equations [b]-[d] show the results of calculations using the regression equation.
Table 2 — Initial data for problem-solving

Then the completed Table 2 will look like this:
The same problem can be solved in another way, namely, using Beer’s law. Since the value of molar absorptivity is already known (0.0053 L. mmol-1.cm-1), the diameter of the cuvette (1 cm), then if one variable is known, the value of the other can easily be found:
A = ∈ * b * C OR C = A / ∈ * b.
Given the known values:
A = 0.0053 * C OR C = A / 0.0053.
For each case:

The results of the calculations were the same.
Conclusion
In this laboratory work, it was necessary to determine the wavelength of maximum absorption for nickel(II) chloride, construct a standard absorption curve as a function of concentration, and identify the molar absorptivity for this substance. It was found that the absorptivity peak of nickel(II) chloride was observed at 435 nm, and the relationship between absorptivity and substance concentration was perfectly described by linear regression with a coefficient of determination equal to 1.00. In other words, both hypotheses were confirmed during the laboratory work. In addition, additional tasks were required to predict the concentration or absorptivity of nickel(II) chloride based on the results obtained.
The constructed regression equation, y = 0.0053x – 0.0002, was used to predict the concentration or absorptivity as a data practice. All objectives were successfully met, so this work can be considered successful. In the context of future studies, it would be helpful to perform similar procedures for different nickel halides to determine how the chemical composition affects the molar absorptivity value.
References
Dotzert, M. (2022). How to make a calibration curve. Lab Manager. Web.
Turney, S. (2022). Coefficient of determination (R²) | Calculation & interpretation. Scribbr. Web.
Wenzel, T. (2023). Beer’s law. LibreTexts Chemistry. Web.