Introduction
Anthropometry is the utilization of body measurements in the evaluation of an individual’s nutritional status (WHO 2013). Anthropometry also gauges dimensions, proportions and constituents of the human body. Parameters such as Mid-Upper Arm Circumference (MUAC), Arm Muscle Circumference (AMC) and skinfold measurements among many others are used to make these assessments. Anthropometry is a commonly applicable cheap and non-invasive technique. Immense useful information can be obtained from anthropometric results. The wellbeing and dietary status of a person, for example, are some of the useful attributes that anthropometry gives. In addition, anthropometric data are vital in ergonomics especially in the designing of tools and equipment to make them comfortable, secure and easy to use. This technique is feasible in people of all ages and can even be used in monitoring the growth of infants.
Adequate nutrition entails taking the right quantities of food nutrients that are necessary for development, energy and maintenance (Al-Rewashdeh & Al-Dmoor 2010). Enhanced dietary status carries out a significant function in the health of a person and is central to socioeconomic growth (Al-Rewashdeh & Al-Dmoor 2010). Failure to take the right nutrients in the required quantities leads to a pathological state, which is referred to as malnutrition. Malnutrition has lasting consequences on people and is, therefore, a stumbling block on socioeconomic growth. Therefore, there is a need to assess the dietary status of people in a society to avert the negative impact of malnutrition. Various techniques such as anthropometry, dietary ingestion, biochemical and medical assessments can be used to evaluate the nutritional status of a person. This report aimed at assessing the nutritional status of students in the author’s class using anthropometry.
Materials and Methods
Measurements of the human body including body dimensions and composition were taken. The percentage of body fat data for the entire class was collected, and the means were computed for males and females. Those measurements were obtained with class members working in pairs and ensuring that their data was recorded in the class data sheet.
Girth measurements were taken using a tape measure. The subject assumed a relaxed standing posture with his arms folded across the thorax during the taking of the waist and gluteal measurements. For the waist measurements, the girth was taken at the narrowest point between the tenth rib and the iliac crest, whereas the hip dimensions were taken at the maximum posterior distension of the buttocks. That region corresponded with the position of the symphysis pubis on the front. The mid-upper arm circumference (MUAC), on the other hand, was taken with the subject standing in a relaxed posture with his arms hanging by the sides. The right arm was somewhat abducted to give room for the tape to go around the arm. The girth was taken perpendicularly to the long axis of the arm halfway between acromiale and radiale. It was assumed that the mid-arm was cylindrical in shape and that a tier of fat enclosed it. It was also assumed that the width of the fat layer was represented by the triceps skinfold (TSF). With those assumptions in mind, the arm muscle circumference was computed.
Demispan, which was the horizontal expanse between the end of the furthest finger away and the middle of the sternum, was obtained with the subject’s upper limbs stretched at the sides.
Skinfold measurement was obtained using a tape measure and a precisely calibrated skinfold caliper (Bodycare Slim Guide, Warwickshire, England). A standard technique of assessment was utilized to ensure accuracy and reproducibility of the results. Measurements were taken on dry healthy intact skin since grasping tacky skin was difficult and could interfere with the accuracy of the measurements. It was imperative to avoid contact of the caliper with infected skin to prevent the introduction of infections. The respondent was directed to maintain the muscles in a relaxed state in the course of the exercise. All dimensions were obtained from the right body region. The skinfold position was pointed out using a pen and ink that dissolved in water. Precise establishment of the midpoints was achieved with the aid of a tape measure. The thumb and the middle finger were used to grasp the midpoints accurately after which the skinfold was lightly drawn away in the opposite direction of the body. The caliper was positioned vertically to the crease with the dial facing up. The position of the dial was about 1 cm beneath the finger as well as the thumb. The caliper was released while at the same time grasping the skinfold in order to put the entire tautness on the skinfold. The dial readings were noted to the next 0.50 mm three seconds following the full liberation of the grasp. At least a pair of measurements was obtained from every location. The measurements were repeated whenever variances of more than 1 mm were noted. Consecutive decreases in dimensions obtained from one site indicated that the fat was compressed. Therefore, a different site was chosen. The ultimate value that was recorded was the average of the two best measurements.
Four sites were used to obtain the skinfold measurement in males and females (the 4-site system). For the triceps, the measurements were taken as the width of a crease present on the rear midline of the higher region of the right limb, above the triceps muscle. That point was in the middle of the acromiale and the radiale. The elbow was stretched out, and the upper limb was relaxed. For the biceps, the dimensions were taken as the width of the upright crinkle on the anterior of the higher right limb at a comparable point to the skin fold of the triceps. The third site was the subscapular. Measurements were taken on a diagonal line about 2 cm sideways and diagonally downhill from the lowest point of the smaller angle of the shoulder blade on the right. The final site was the suprailiac where measurements were taken in the mid axillary line just after the iliac crest.
The sum of the skinfolds was used to compute body density using the provided equations. The Siri equation was used to compute the % BF. The percentage body fat was also established by a bioelectric impedance technique using bioelectrical impedance scales (Tanita, TBF-300, Tokyo, Japan). A body fat handheld monitor (Omrod, BF306, Omrod Healthcare, UK) and a freestanding stadiometer (Leicester height measurement, SECA, Birmingham, England) were also used to determine body fat. Results from all those methods were recorded for subsequent analyses.
Results
Table 1: Means of weight (kg), height (m), body mass index (BMI, kg m-2), of male and female students.
The data in the above table include means ± standard deviations of the various parameters.
The data revealed that male students had a higher average height and weight (69.6± 5.992058 kg and 1.7528± 0.08674 meters respectively) than their female counterparts (55.15164±6.402023 kg and an average height of 1.60± 0.075218). The male students also had slightly higher body mass index values (BMI 22.75714±3.13308) than the female students who had an average BMI of 21.60615± 2.764638.
Table 2: A comparison of the percentages of body fat using different methods.
From the above table, it was realized that there were obvious disparities in the measurements obtained from the two categories of techniques. The establishment of percentage body fat using bioelectrical impedance techniques yielded higher values than when skinfold measurements were used. Within the skinfold techniques, it was realized that Siri method produced lower percentages of body fat than the Durnin and Wormsley method. In addition, the standard errors observed in the Siri method as depicted by the standard deviations showed that a higher magnitude of errors was realized in that method than in the Durnin and Wormsley method. In the bioelectrical impedance techniques, lower percentages of body fat were attained in the freestanding stadiometer than with the handheld monitor.
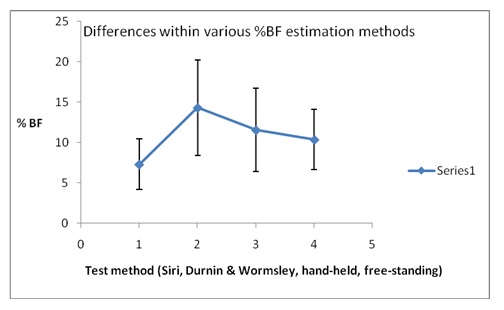
Table 3: A comparison of % BF between males and females when the Siri method was used to compute body weight.
The above table showed the differences in % BF when the body fat was estimated using Siri method.
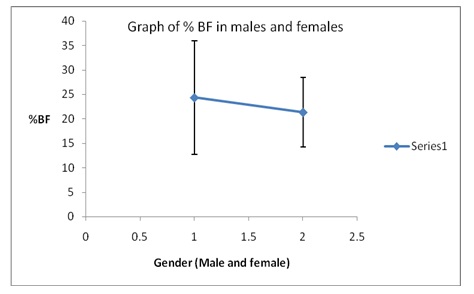
From the data shown in the above tables, it was evident that there were variations in the techniques used in the determination of the percentage body fat. It was also evident that female students had a slightly higher % BF than male students.
Discussion
Male students displayed superior average height, weight and BMI values compared to the female students. That could be attributed to differences in rates of growth between the genders at certain periods of development (Al-Rewashdeh & Al-Dmoor 2010).
Of the various methods of determining body fat, it was evident that there were disparities in the obtained results. That raised questions about the validity and accuracy of the test methods. According to Wells and Fewtrell (2006), the most accurate technique of determining the composition of the human body was cadaver analysis and other forms of in vivo techniques. However, it was not feasible to perform cadaver analysis on living subjects. Consequently, a combination of different techniques was essential to come up with precise results since there was no single technique that could attain accurate outcomes under all circumstances (Wells & Fewtrell 2006).
It was also worth noting that in vivo techniques predicted body fat from estimations of body properties. Therefore, both techniques had chances of producing methodological errors during data collection and making of assumptions. Conventionally, “skinfold thickness measurements have been used to rank individuals in terms of relative ‘fatness’ or to assess the size of specific subcutaneous fat depots” (Wells & Fewtrell 2006, p. 612). The skinfold technique claimed very little variations between various observers. However, the precision of the technique was hampered when performed on subjects with obesity. The raw skinfold data were useful indicators of the localization of body fat. However, the key shortcoming with using the skinfold technique was the unavailability of published reference data especially in children.
A separate anthropometric study by Arroyo et al. yielded results that were similar as those realized in the above practical (2004). It was realized that the Siri method attained the lowest percentages of body fat compared to other techniques (Arroyo et al. 2004). Bioelectric impedance techniques, conversely, yielded high % BF values. Those results showed that the extent of agreement between skinfold measurements and bioelectrical impedance techniques was low (Arroyo et al. 2004).
Bioelectric impedance techniques quantified the body’s resistance to a slight electrical current. Correlating bioelectrical information and height enabled the approximation of TBW (total body water) (Wells & Fewtrell 2006). Age and other population data (such as health status) had a significant influence on the relationship between TBW and bioelectrical data. Consequently, it was noted that the technique realized errors of about ±8 % fat content when applied to healthy people. Inflated % BF results meant that an individual was overweight or obese, whereas extremely low % BF results showed than a person was underweight or malnourished. Therefore, it was imperative to make meaningful comparisons between the available techniques to prevent false labeling of subjects as obese or underweight.
Conclusion
Various techniques were available in the determination of body fat among other parameters in anthropometric studies. However, there was no standard method of application as different techniques had varying limitations and degrees of errors. Consequently, it was necessary to perform comparative studies to improve the precision of the results. In addition, it was essential that each result was interpreted cautiously to ensure accurate diagnosis of malnutrition and obesity.
References
Al-Rewashdeh & Al-Dmoor 2010, “Anthropometry and dietary assessment of males and females at Mu’tah University,” Journal of Applied Science, vol. 10 no. 9, pp. 759-765.
Arroyo, M., Rocandio, A. M., Ansotegui, L., Herrera, H., Salces, I., & Rebato, E 2004, “Comparison of predicted body fat percentage from anthropometric methods and from impedance in university students,” British Journal of Nutrition, vol. 92 no. 5, pp. 827–832.
Wells, J. C. K. & Fewtrell, M. S 2006 “Measuring body composition,” Archives of Disease in Childhood, vol.91 no. 7, pp. 612-617.
WHO 2013, Physical status: the use and interpretation of anthropometry, Web.