Task Description and Challenges
One of my daily tasks is hand-washing the dishes after lunch or dinner. In general, this is not a complex operation. Still, it is routine and takes up much time that I could have spent on other activities, such as studying or engaging in leisure pursuits like watching movies or exploring social media. At the same time, it is impossible to completely give up washing dishes because I like to keep things clean, and the constant use of plastic dishes is not eco-friendly and aesthetically pleasing. Thus, I will choose dishwashing as a daily process that I would like to reduce the time for.
Analysis with a Flowchart
The figure below shows a flowchart of the dishwashing process. I have purposely shown that it is a cyclical process, which means that this routine is repeated every day and can be exhausting. Accordingly, I am interested in reducing the time spent on this procedure.
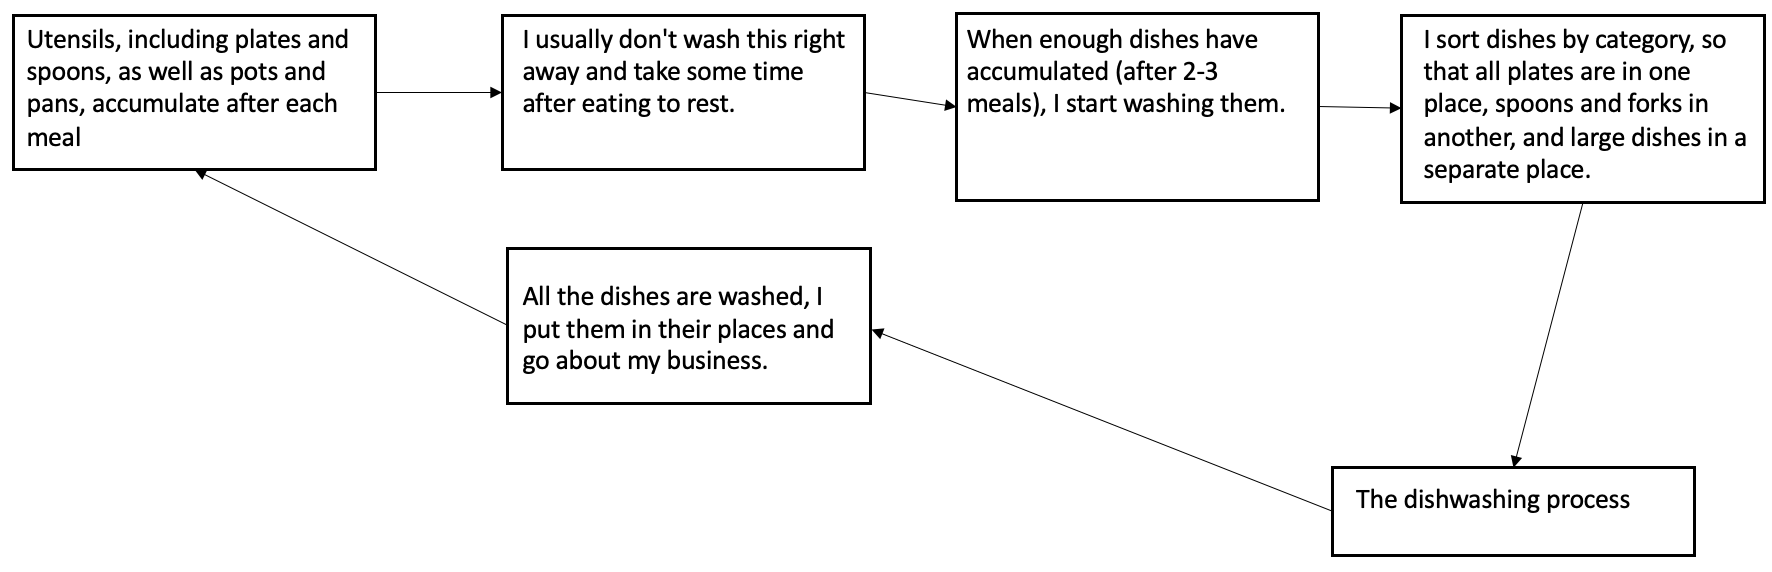
Factors that determine this process include the number of meals per day, the difficulty of cooking, the number of dishes used during cooking, and the motivation to wash the dishes immediately or leave them in the sink throughout the day. Since the time spent per act of dishwashing is the variable I seek to reduce, I would use the time characteristic as the primary metric. As a related metric, I chose the total number of dishes I should wash at one time.
I would use quantitative methods as a predictive method. Specifically, I would collect information over, for example, ten days, on how long it takes me to wash dishes based on the number of washed dishes (in pieces). I would enter this data into MS Excel and run a regression analysis to determine the regression equation (Norris, 2022). I estimate the overall trend for the increasing or decreasing function using this equation. I also predict how the number of dishes affects time; I would actually find my performance as a dynamic function.
Applying the PERT/CPM Business Model for Performance Improvement
Business models that improve performance could also be applied in this case. Specifically, I could use PERT/CPM to assign the time required for each step in the process to the corresponding step in the flowchart. For each step, I would denote the average time to complete the plan, as well as the time under the most optimistic (shortest) and pessimistic (longest) scenarios. Finally, I would calculate a PERT score for each step to find the most efficient method of washing the dishes using the beta distribution by finding the shortest path. A great visualization tool for implementing PERT might be a Gantt chart.
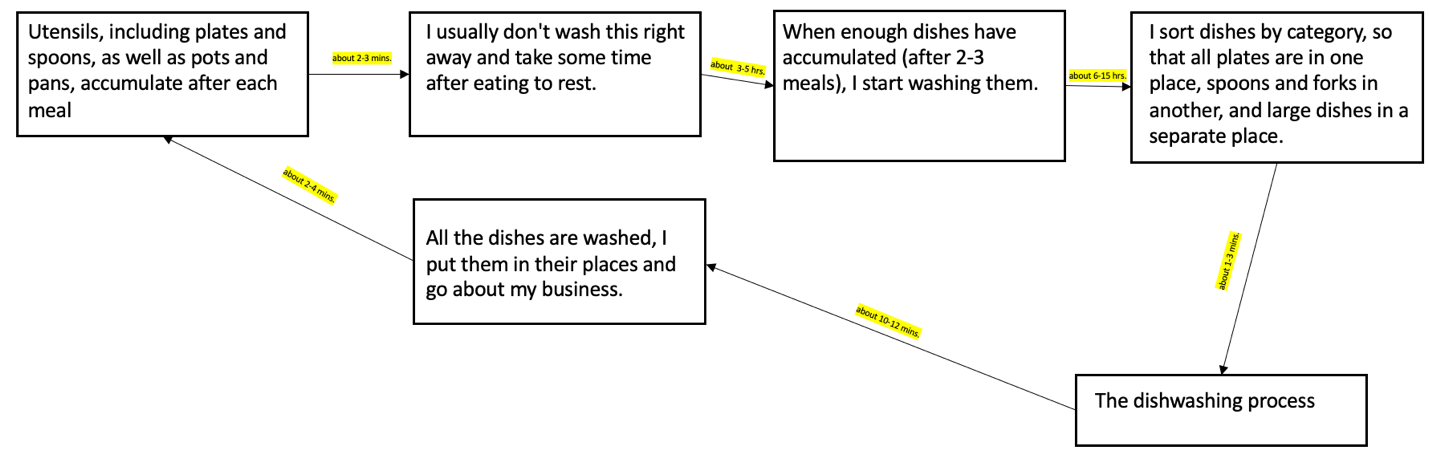
The figure above shows my average time to do each action. The longest step is finding the motivation to do the dishes, which can take up to 15 hours daily. All that time I think about what I need to do, that action. That said, the shortest step in my process is sorting the dishes into categories, which can be completed in under three minutes.
Reference
Norris, E. (2022). The linear regression of time and price. Investopedia. Web.