Introduction
The use of statistical tests is an appropriate analysis strategy for making informed, data-driven decisions. Business is one such area in which the use of descriptive and inferential statistics can minimize error rates and biased decisions and, therefore, create more reliable and unbiased conclusions (Black, 2023). This paper proposes using statistics to examine the experimental data in depth and test the hypothesis of an average minivan consumption of 28 miles per gallon. The report presents the results of the data analysis and answers questions about whether the results are consistent with the car company’s claims.
Sample Mean, Standard Deviation, and Confidence Interval
Calculating the Confidence Interval
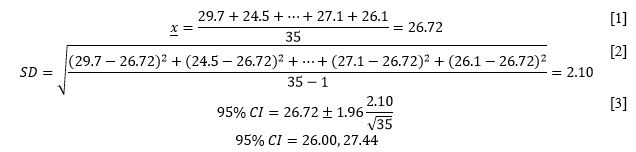
The mean run was calculated as 26.72 (SD = 2.10), as shown in equations [1] and [2]. The confidence interval must be used to understand the frame within which the true population mean is located. Since a 95% confidence interval was used, this means that there is a 5% chance of making an error. For such a confidence interval, the z-score is 1.96. Then the confidence interval is defined as 95% CI [26.00, 27.44].
Interpreting the Confidence Interval
The calculated confidence interval shows that it is 95% certain that the actual population average is between 26.00 and 27.44 miles/gallon. The car company has stated that the population average is 28 miles/gallon, which implies that this number does not fit within the calculated interval. The value that the company claimed was the average consumption of their vehicles in miles/gallon was not within the confidence interval and was 0.56 miles per gallon to the right of the edge.
This may indicate that the company’s conclusion is incorrect because its result does not match the actual data. The company may have deliberately or inadvertently provided false data about the consumption of their minivans, which is not supported by the 95% confidence interval calculation. On the other hand, it is known that increasing the accuracy of the interval leads to extending its limits. Therefore, it is possible that the car company could have used a 99% or even 99.7% confidence interval that included a 28 miles per gallon consumption, so additional verification is required.
Hypothesis Testing: Two- and One-Tailed Tests
Calculating and Interpreting a Two-Tailed Test
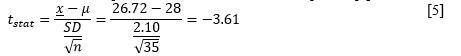
A two-tailed, one-sample t-test was used to estimate the differences between the claimed value and the test statistic to test the car company’s claim. Specifically, the null hypothesis postulates that the sample mean is 28 miles per gallon, while the alternative hypothesis suggests that it is not. The calculation of the test statistic is shown in Equation [4]: the t-statistic is -3.61. Using standard p-tables for 34 degrees of freedom, the calculated t-value, and a 0.05 threshold of significance allows us to estimate that the p-value is .000988. This value is significantly lower than the significance threshold (p < α).

A one-sample t-test was performed to determine if there is a gap between the sample mean and the population mean. In other words, this test determines if a particular sample comes from that population. The results identified statistically significant differences, t(34) = -3.61, p <.05. The p-value calculated with the table appears to be below the threshold of significance alpha: this rejects the null hypothesis and indicates that there are significant differences between the sample mean (M = 26.72) and the reported flow value (M = 28). This once again confirms the fact that the claim of 28 miles per gallon seems to be unsubstantiated because it is not consistent with the results of the calculations.
Calculating and Interpreting a One-Tailed Test
In past sections, a two-tailed test was conducted for which the hypotheses were non-directional. This only allowed us to estimate the significance of the differences between the average and reported fuel consumption in miles per gallon. This time, it is proposed to conduct a one-tailed test whose hypotheses have directions.
Specifically, the null hypothesis indicates that the sample mean is greater than or equal to (≥) the reported value. In contrast, the alternative hypothesis suggests that the sample mean is lower than the stated value, which is based on previous results from descriptive and inferential statistics. The results of the t-statistic calculations do not differ from the previous ones and are shown in Equation [5].
However, the p-value, in this case, will be different because only one side of the normal distribution is used, and thus, the p-value must be half as high. Specifically, for a t-statistic of -3.61, 34 degrees of freedom, and a one-tailed test, the corresponding p-value is .000494.
A one-sample, one-tailed t-test is used to assess the significance of differences between two averages in the context of directional hypotheses. Specifically, the experimental (alternative) hypothesis suggested that the sample mean was less than 28 miles per gallon. The analysis showed that the calculated p-value was below the alpha significance threshold, and the t-value fell within the area of outliers. This suggests that there is enough evidence to reject the null hypothesis and thus accept the alternative hypothesis. In other words, the sample mean is significantly lower than the car company’s reported consumption, so claims of 28 miles per gallon have no basis, as shown by the statistical analysis.
Discussion
Methods
The present work focused on using statistical tests for hypothesis testing. Specifically, descriptive and inferential statistics were used, each performing a different analytical function. Descriptive statistics were used to determine surface patterns in the distribution of data in the sample. This included calculating the mean and standard deviation, as well as the number of observations and the confidence interval. Inferential statistics were used to determine the differences between the mean and the reported values and were implemented through hypothesis postulation and the use of two-tailed and one-tailed t-tests.
Both types of statistics were used to fulfill the primary purpose of the paper, which was to determine the validity of the car company’s claim that the consumption of their minivans was 28 miles per gallon. However, all types of statistics used failed to support this claim. The descriptive statistics showed that the 95% confidence interval did not include the number 28. A two-tailed t-test showed significant differences between the sample mean and the stated value, and a one-tailed t-test showed that the sample mean was significantly lower than the stated value. The statistical analysis performed was helpful for several reasons.
First, it allowed me to understand that companies’ claims may be driven by marketing or other promotional motives but may not be completely honest. Second, it allowed me to realize that conducting statistical tests to analyze data is a worthwhile strategy. Third, it allowed me to learn that when conducting tests, one must be consistent and conduct one test at a time to avoid confusion and to keep the results academically reliable.
The Manufacturer’s Claim
Statistical tests confirmed that the car company’s claims had no basis and were not true. To put it another way, their minivans did not have an average mileage of 28 miles per gallon, but were significantly lower. Specifically, the sampling results showed that the average mileage was 26.72 (SD = 2.10) miles per gallon; the 95% CI did not include the claimed value. Both inferential tests also confirmed the difference between the sample mean and the population mean.
Conclusion
The statistical tests were conducted to analyze the car company’s claims that the average fuel consumption of their minivans is 28 miles per gallon. It is worth clarifying that none of the statistical tests were able to confirm this claim, and the final consumption was statistically significantly lower. The descriptive test confirmed that the average sample flow rate was 26.72 (SD = 2.10), and the 95% confidence interval included values from 26.00 to 27.44, which, even when rounded, did not include 28 miles per gallon. Both the two-way and one-way t-tests showed that the average was significantly lower than the claimed 28 miles per gallon.
The results suggest that the car company inadvertently or intentionally misstated the consumption claims of its minivans. This has practical implications since it shows that per gallon, a minivan can go about two miles less than the company indicates, as indicated by the left margin of the 95% confidence interval. Given that the average minivan includes a fuel tank of up to 20 gallons, such a car would travel 40 miles less than the car company claims (Reference, 2020). This could be construed as misleading the consumer with incorrect advertising claims.
Recommendations
Based on the results, it is reasonable to offer several recommendations for the car company to improve its customer service experience. First, statistical tests would be proper to analyze the honesty of each advertising statement they make. Secondly, for vehicles already produced and sold, the company could offer customers a discount system or a lucrative loyalty program for violating the rules of fair advertising (García-Sánchez et al., 2020). This is expected to improve communication between the company and customers by increasing transparency and openness.
References
Black, K. (2023). Business statistics: For contemporary decision making. John Wiley & Sons.
García‐Sánchez, I. M., Rodríguez‐Ariza, L., Aibar‐Guzmán, B., & Aibar‐Guzmán, C. (2020). Do institutional investors drive corporate transparency regarding business contribution to the Sustainable Development Goals? Business Strategy and the Environment, 29(5), 2019-2036. Web.
Reference. (2020). How many gallons of gas does a minivan hold? Reference. Web.