Process Evaluation
During production, waste is defined as any process that does not add value to the final product. Examples of wastes are excessive or unnecessary motion, excessive inventory, periods used in waiting, over-processing, production defects, overproduction, and transportation. The Lean concept utilizes principles and techniques to reduce operational waste (Baker et al., 2018). Lean is a continuous process where a firm understands value and manufacture according to customers’ requirements. The process first requires identification of the customers’ requirements and what adds value to them. The management should then eliminate the obvious wastes such as excessive motion and repetitive processes. After that, one should map the processes to separate the value adding from the non-value adding processes. The next action is to identify the bottlenecks and causes of process variations using the Kaizen processes. From the observation, establish the processes that require improvement through cross-training. The following are two flow charts; figure 1 and figure 2 represent a process before and after improvement respectively.
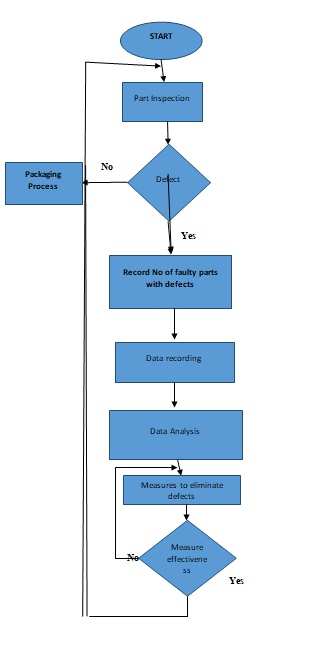
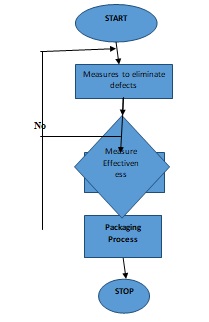
The waste eliminated in the above process is defects, repetitive processes such as data recording, analysis, measuring effectiveness and inspection.
Evaluation of Control Chart and Process
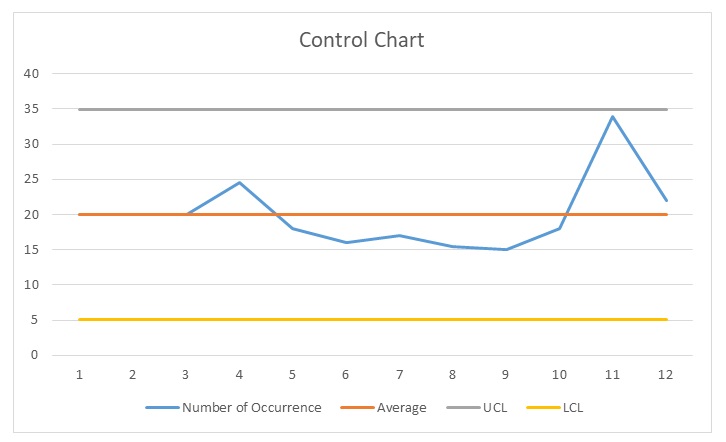
A control chart displays changes of events over time. The graph, also known as the shewhart graph, consists of three lines, the upper, lower and average lines, which are drawn from historical data. The graph is used to reveal whether a process is in control or out of control by comparing current data. Drifts and shifts in mean and other sources of the process result in Process variation. Special cause variation and common cause variation originate from Random effects. The capability of a statistical process provides a long term performance of the methods, measurements and statistical boundaries. When using six sigma technique, one should be familiar with the type of data they are working with. Data used for evaluation may either be continuous or discrete. The capability of discrete data can be measured using various software tools either in Poisson or binomial distributions. The I-MR control chart can be used to check the process stability of a control chart. Table 1 and figure 3 below represent a SPC evaluation control table and figure respectively.
Table 1. Evaluation Control Table.
UCL= B$13 + B$14*3
LCL= B$14 +B$13*3
Executive Summary
During production, waste is defined as any process that does not add value to the final product. Examples of wastes are excessive or unnecessary motion, excessive inventory, periods used in waiting, over-processing, production defects, overproduction, and transportation. Occurrence of waste in processes increases the cost of production which results in reduced profits of a firm. The Lean concept utilizes principles and techniques to reduce operational waste (Baker et al., 2018). A firm should aim at reducing waste to increase process consistency, improve operation performance and ensure an increase on the level of output.
To eliminate waste during production or processing, a firm can apply a tool known as process mapping. Process mapping involves evaluation all the decisions and processes in a business activity with use of a diagram. It involves defining the role of each employee or stakeholder in business processes, identifying the required standards of operations, and the measures of success. An organization can also improve communication among employees and the management, encourage innovation through brainstorming ideas, and documentation of processes in process mapping. The activity helps an organization to identify areas that need improvement to increase efficiency and productivity.
The lean technique eliminates overproduction waste by simplifying the final product to cut extra stages processing. Some of the ways used to improve the statistical process using lean concept are: identification of factors that result in quality customers’ value (Baker et al., 2018). The concept helps in establishing the various steps taken in a statistical process and streamlining the process. The lean concept also guides a firm to producing in accordance to demand and focusing to perfect their processes by constantly identifying and eliminating waste.
Moreover, lean and sigma concepts should be applied together to improve work processes and eliminate production waste. When using six sigma technique, one should be familiar with the type of data they are working with. The capability of a statistical process provides a long term performance of the methods, measurements and statistical boundaries. However, drifts and shifts in mean and other sources of the process result in Process variation. Special cause variation and common cause variation originate from Random effects. The capability of discrete data can be measured using various software tools either in Poisson or binomial distributions. The I-MR control chart can be used to check the process stability of a control chart. Data that is recordings of changes over a period can be plotted in a time series (Baker et al., 2018). To ensure stability of the data, one should choose an appropriate chart for analysis, and time for data collection and plotting the data as well as time to analyse data as shown in the table 1 above.
SPC requires manufacturers to evaluate the quality of production by monitoring and controlling the production process. This objective is met by testing random samples during production and recording their data. The data used in the analysis is also collected from various machines and measurements of end products. Baker et al. (2018) posited that the management team can assure quality production with minimal waste by monitoring the process of operations. When using SPC, the management should evaluate their current machinery to ensure all waste is eliminated. The key features of the processes and machine used should be evaluated and recorded before evaluation of waste. These wastes include rework, over-production, waiting period, and excessive inspection time among others. After the evaluation, data would then be collected and evaluated according to the machinery key characteristics.
A firm should implement SPC processes to move from detecting any faults in production to preventing it. SPC ensures a firm produces outputs that have been planned from the initial stages which helps to meet the customers’ requirements. The process also increases a company’s competitive advantage as it emphasises on the critical processes. Amid the trend to increase prices of raw materials used for production, SPC reduces processing cost by eliminating waste. However, to address the additional cost of implementation of the SPC process in a firm, it should start with training the employees on how to use the process. That way, a firm will save cost of hiring an expert to implement the process.
Reference
Baker, A. W., Haridy, S., Salem, J., Ilieş, I., Ergai, A. O., Samareh, A. & Anderson, D. J. (2018). Performance of statistical process control methods for regional surgical site infection surveillance: A 10-year multicentre pilot study. BMJ Quality & Safety, 27(8), 600-610.