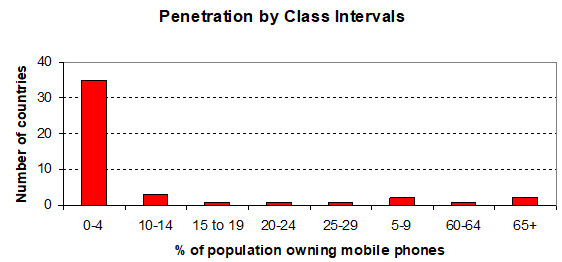
This analysis delves into the correlates and antecedents of cellular telephone acquisition and ownership rates for a 2005 database spanning 46 countries. Interest is sparked, first of all, by wide disparities in mobile telephony penetration, ranging from zero to 69 percent of the population in the case of the United States. And there is a marked positive skew, suggested first of all by an average that is close to the low end of the distribution (8.12 percent) and amply demonstrated by Figure 1.

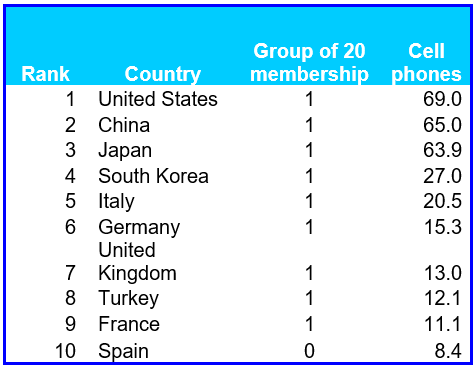
Being in the top rank globally in terms of industrialization and financial clout, as exemplified by membership in the Group of 20 may be an important contributing factor but it is not the only one. Table 1 (overleaf) does show that nine of the top ten mobile phone markets are indeed G-20 nations. However, non-member Spain broke into the ranks of the top ten cellular telephony markets. And other G-20 countries are dispersed from 11th (Australia) to 34th rank (KSA). At the same time, oil wealth alone is no guarantee of receptivity to cellular phones. Two of the largest producers, Libya and Nigeria, have precisely zero ownership.


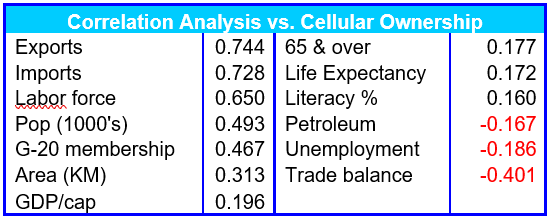
Correlation analysis (Table 2) reveals that per-capita income, the traditional international benchmark of comparative economic wellbeing based on domestic economic transactions alone, bears only a mediocre relationship with cellular phone ownership. The three most important antecedents are the size of the labor force and the level of international trading activity as measured in absolute dollar or euro inflows and outflows. Nor is it the balance of trade, i.e., export surpluses that fuel demand for mobile handsets and subscription services because there is a substantial inverse relationship. One perforce concludes that country markets bear the most potential when they have met a certain critical threshold of income earners and the economy is so oriented towards external trade as to denote a great degree of openness to foreign discretionary and convenience goods.