Introduction
Mission
The company plans to pursue a global low-cost leadership strategy centred on selling its branded and private-label footwear at lower rates in order to obtain a competitive advantage over other companies in the industry.
Vision
Our mission is to provide high-quality athletic footwear at competitive prices while giving customers a wide range of options.
Values
- Curiosity: The Delta Designers, always looking for fresh perspectives and inspiration to improve their solutions, agree that travel is invaluable.
- Respect: Delta Designers prioritize empathy and inclusion in product and service design, and they believe it is crucial to treat everyone with respect.
- Listening: Delta Designers firmly believe that listening to one’s customers, peers, and end-users is the best way to get the insights and feedback necessary to produce superior designs.
- Reliability: Delta Designers works hard to earn the confidence of their customers and the support of those who are interested in their success.
Corporate objectives
- Goal: Increase the company’s revenue by entering new markets.
- Strategy: By the end of the year, two new geographical markets will be entered.
- Year 11: Conduct market research to discover and analyze potential new markets’ economic and political situations.
- Year 12: Create a business strategy for accessing the targeted markets, including marketing, sales, and distribution plans.
- Year 13: Introduce goods in two new markets, connect with local firms, and raise brand recognition.
- Year 14: Assess the success of the new markets and make any required changes to the plan to improve income.
- Measurement: In the first year of operation, achieve a revenue growth rate of at least 20% in the new markets.
A Reflective Account of the BSG Experience
Year 11
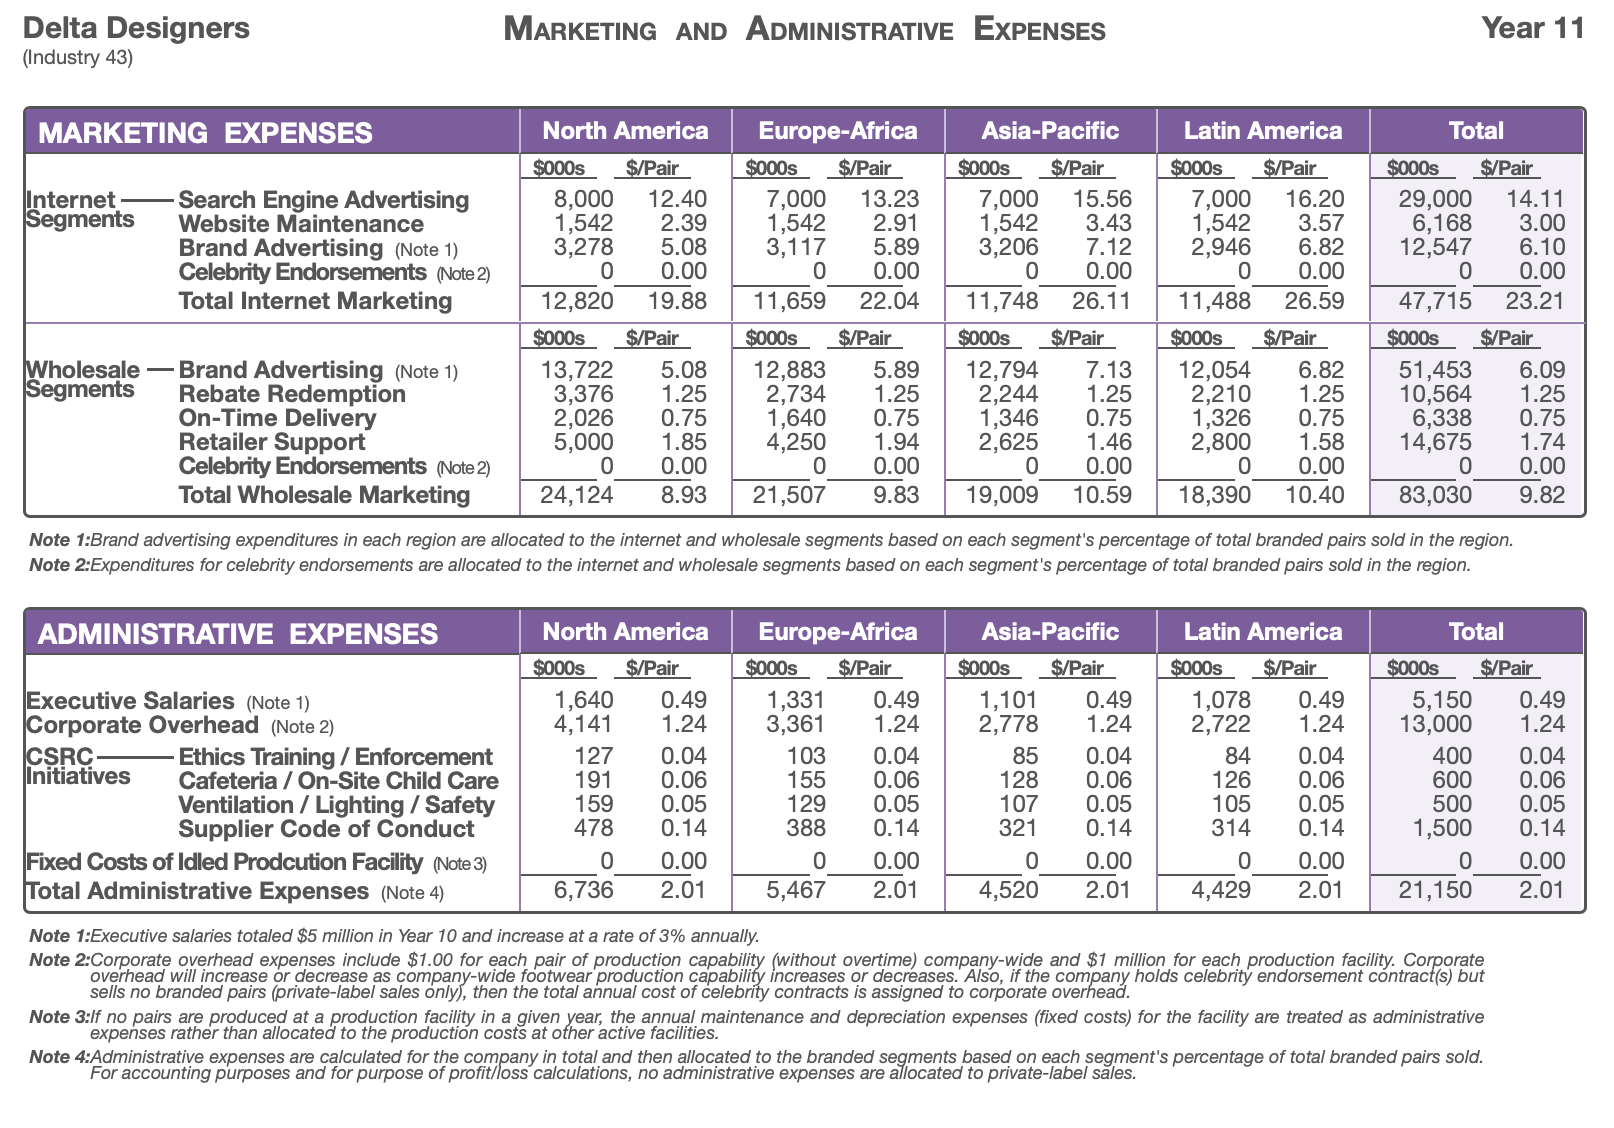
To cut down on marketing expenditures, the company prioritized free methods, including organic social media interaction, email marketing, low-cost industry events, word-of-mouth marketing, and search engine optimization. Changing customer preferences, less advertising budgets, and fiercer competition in the marketplace certainly influenced the decision-making process (Liu et al., 2019). The organization has learned the value of cost optimization in increasing profits due to prior BSG initiatives and applied that knowledge to its decision-making process.
Reduced marketing costs, more profits, and more brand recognition and consumer involvement are all possible results of deciding to cut corners on advertising. The company’s website traffic, social media following, and search engine rankings might have all grown due to the optimization work. The company has realized that it may be successful with less expensive forms of promotion; this is evident from the advertising expenses incurred, which total $83,030,000, as shown in Figure 1. The higher expenses indicated in Figure 1 may result in low profits and returns to shareholders. As seen in Figure 1, the corporation may have grasped the necessity of investing in marketing activities that match target audience needs and likes rather than the latest marketing fads to reach more demographic regions.
Year 12
As a result, we seriously considered several considerations before settling on a course of action. We understood careful cost management was essential to sustain competitiveness and maximize revenues. Market forces were taken into account as one of the elements. Cost savings were identified by examining market tendencies, consumer needs, and the competitive environment (Liu et al., 2018). Therefore, before deciding on a plan of action, we carefully examined a number of factors.
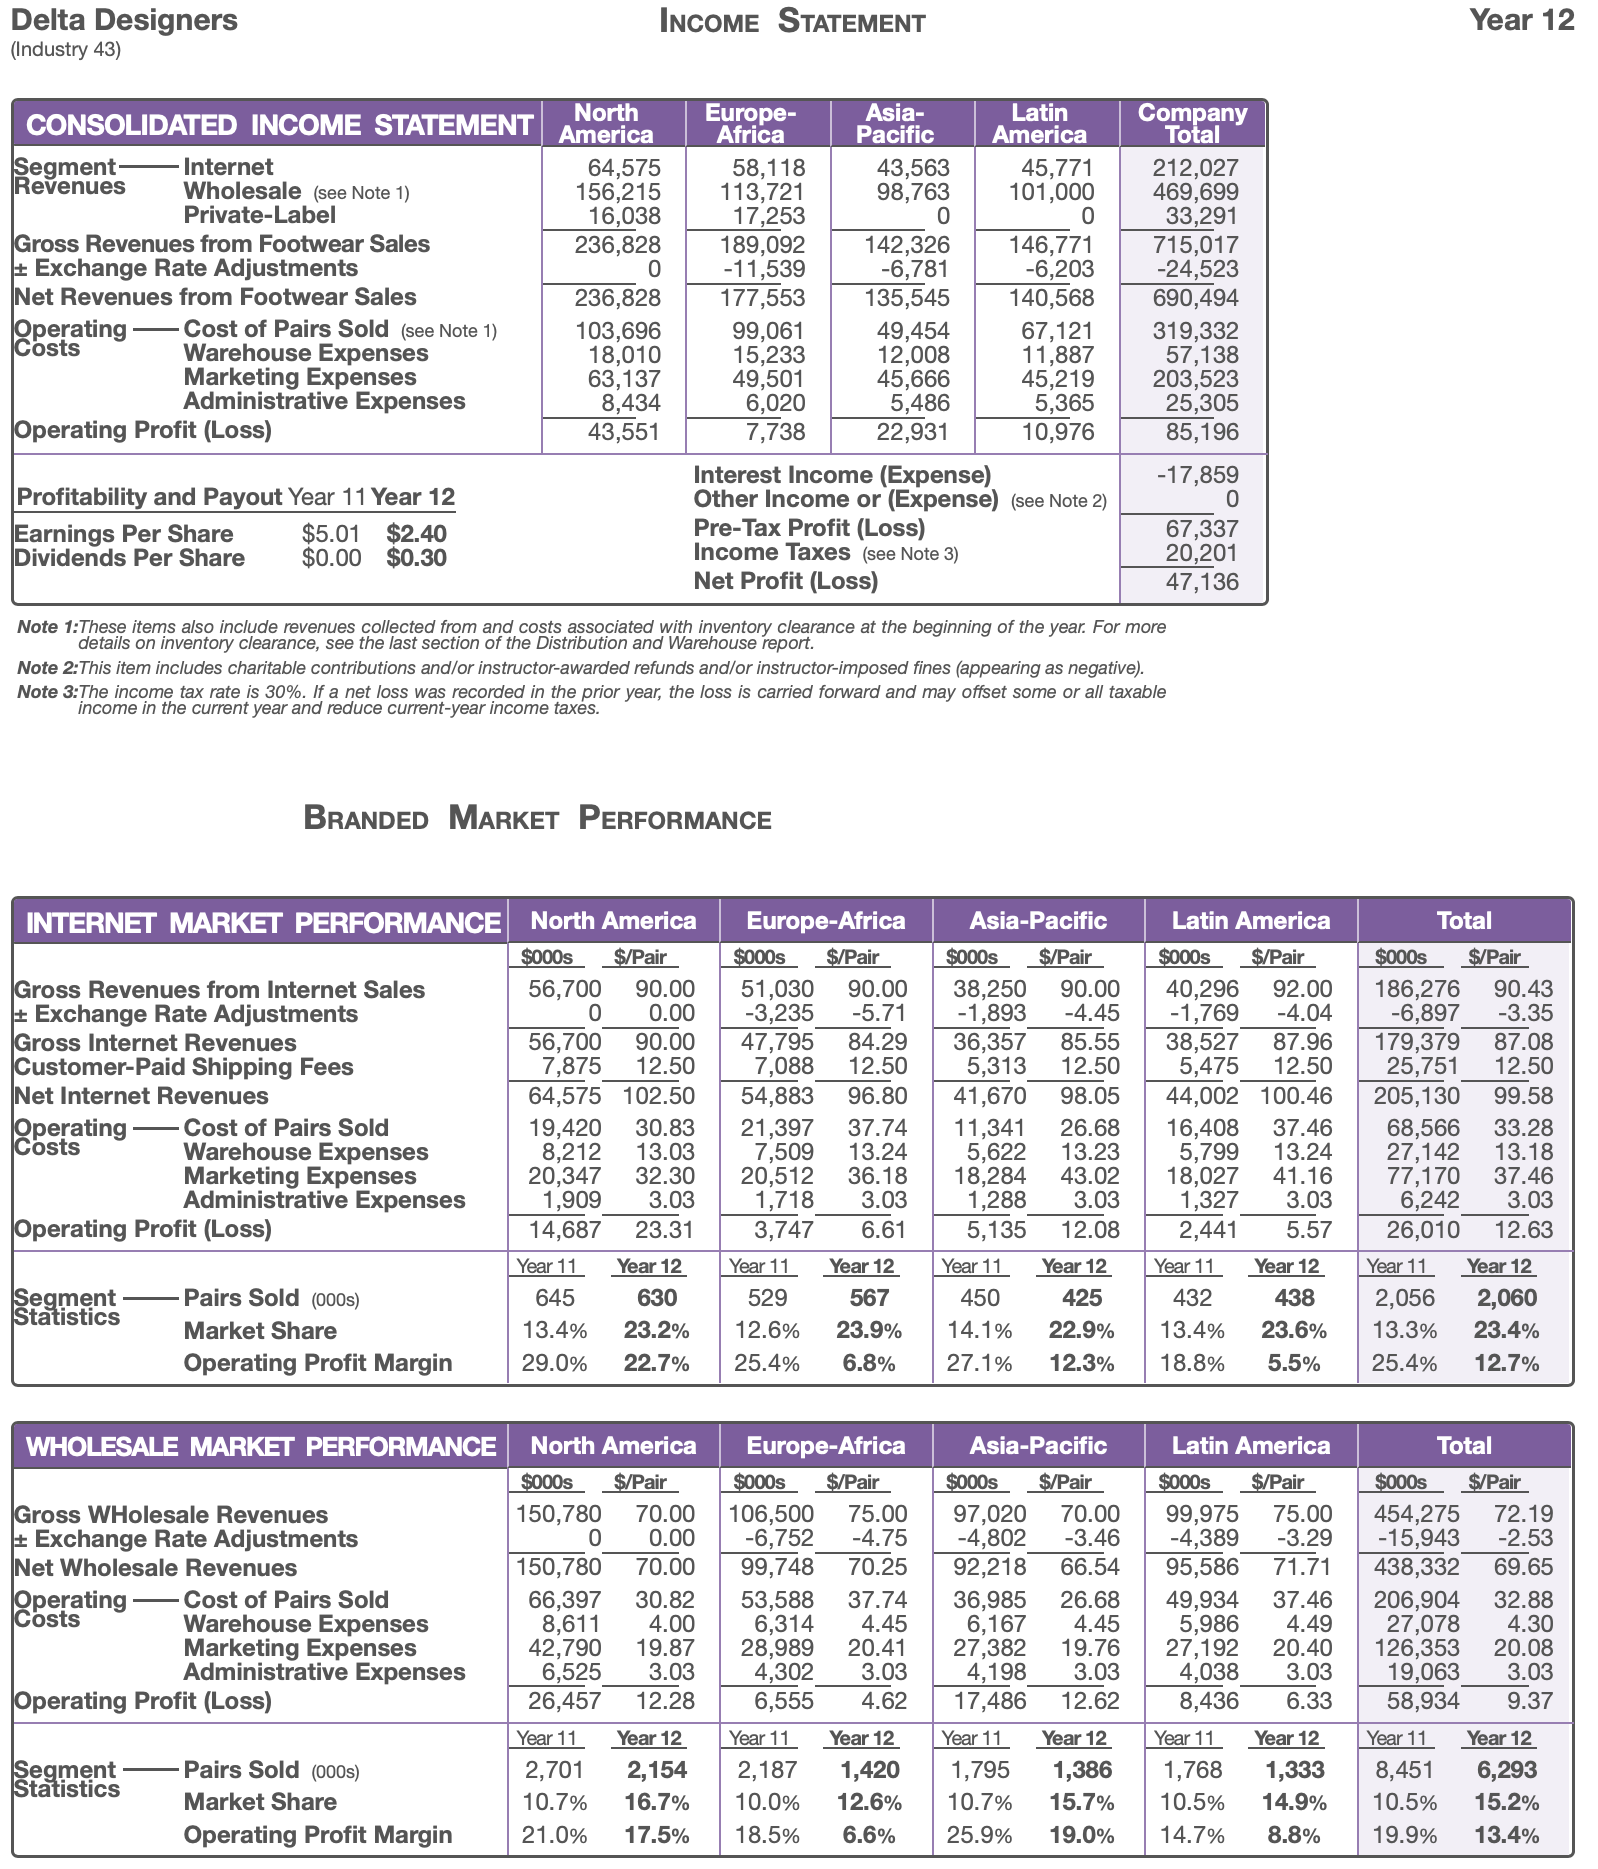
Our research led us to conclude that moving part of our manufacturing to less expensive nations would be beneficial. Our labour and manufacturing expenses totalling $85,196, as depicted in Figure 2, were significantly reduced as a result. We merged several of our divisions into others and reduced the number of employees. By cutting expenses by almost 20%, we were able to boost our profitability dramatically.
Moreover, we were able to keep our market share and keep up with the competition with our goods. The need for careful budgeting was highlighted as a key takeaway from this event. In order to keep expenditures to a minimum without sacrificing quality, it is crucial to conduct frequent reviews and analyses.
Year 13
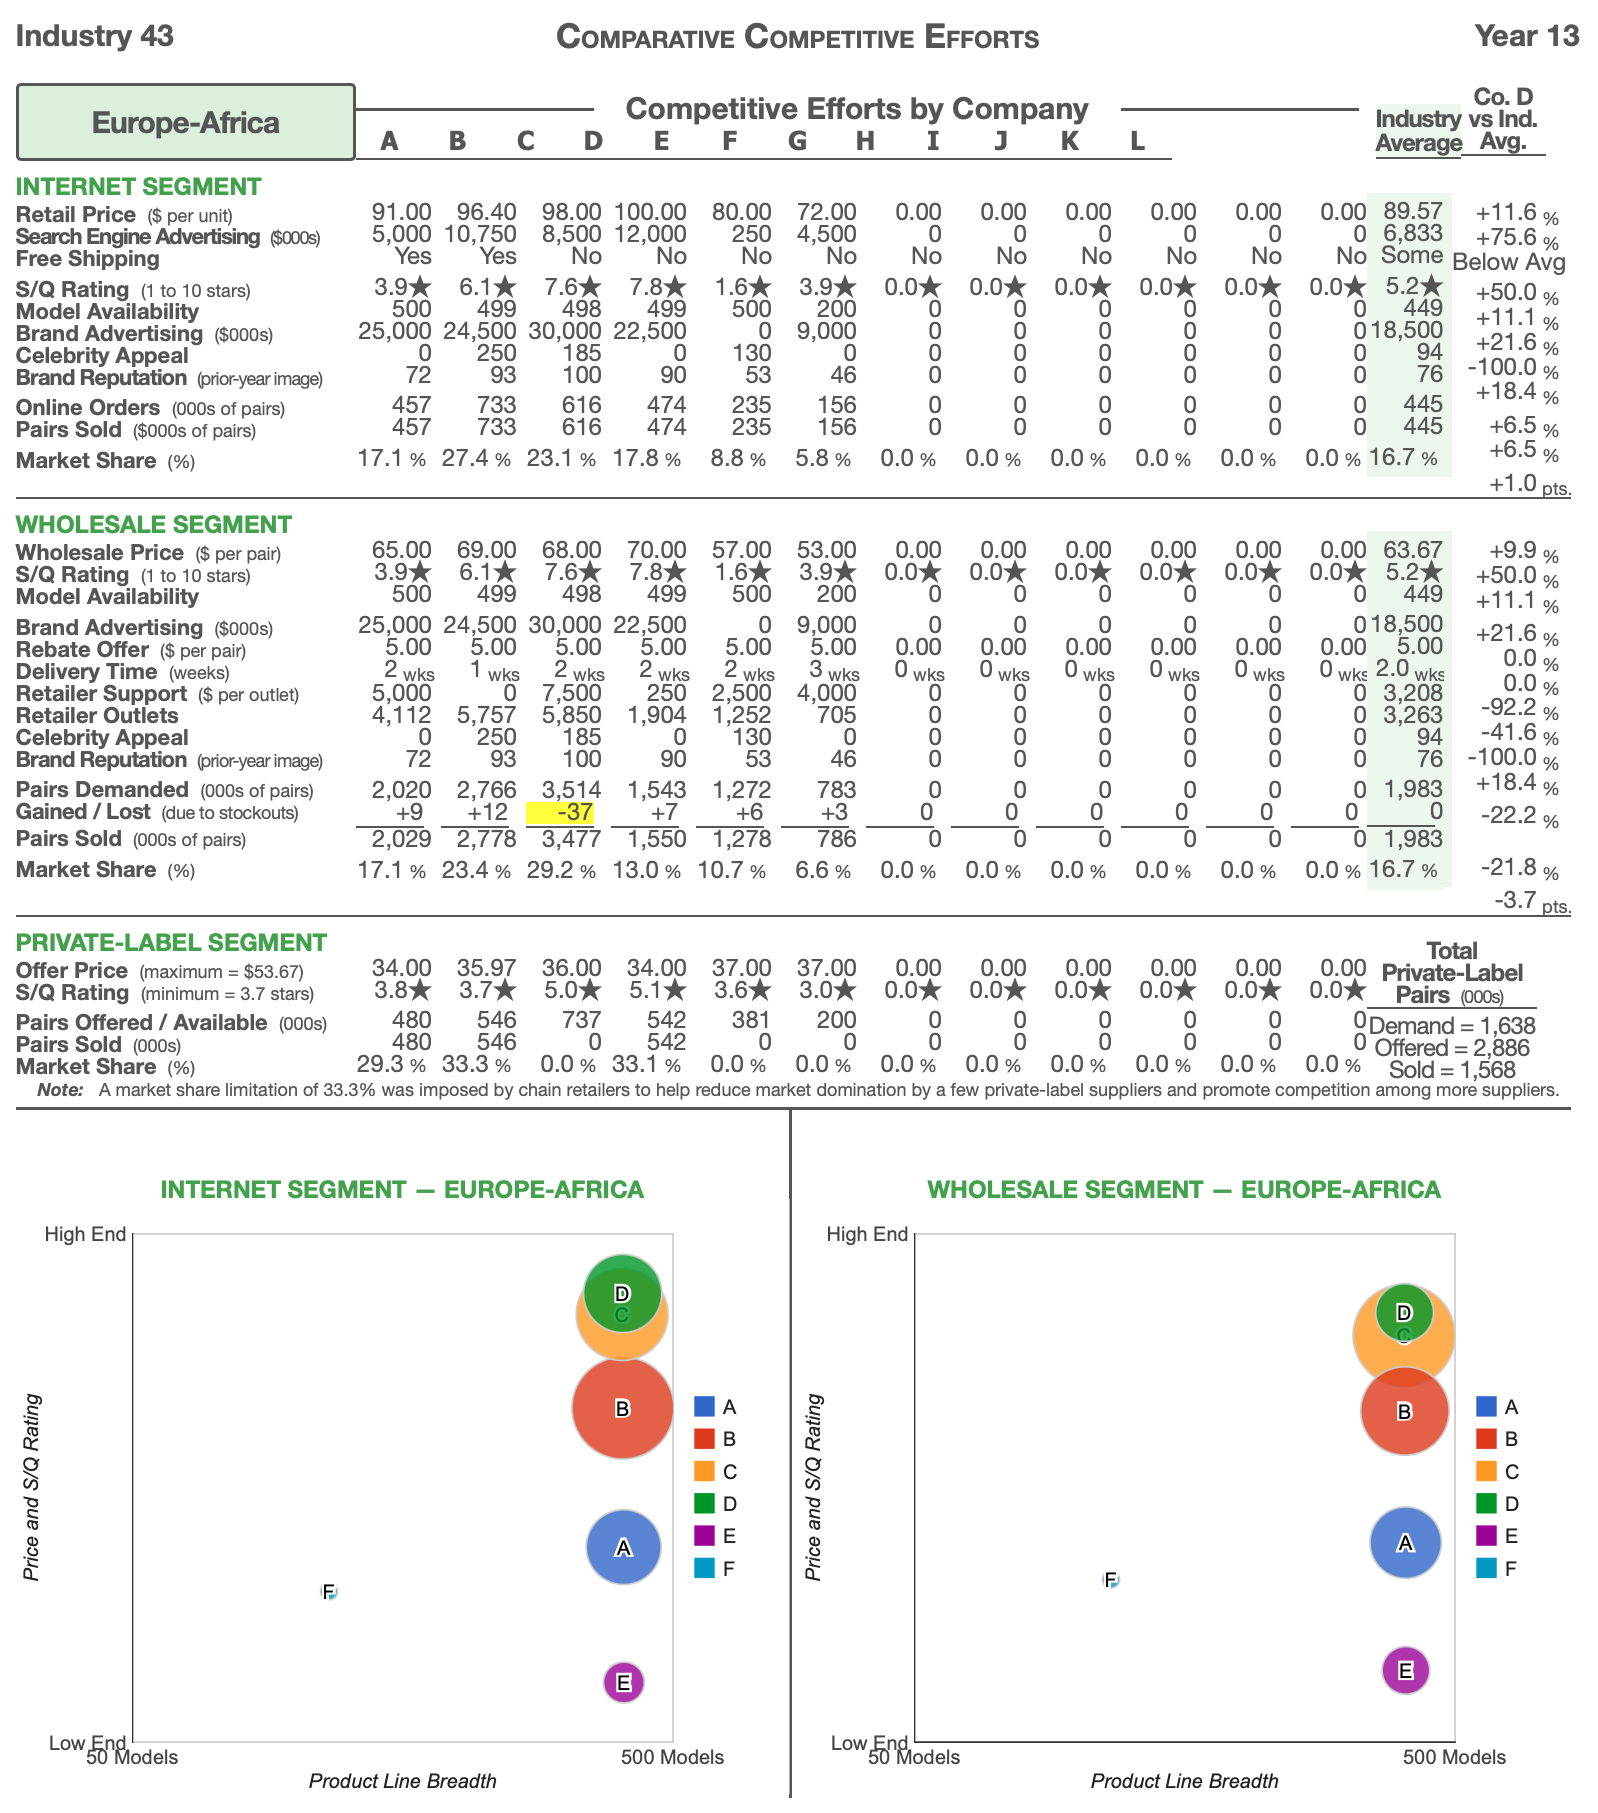
Market selection and positioning were crucial to our corporate choices at Delta Designers. In the thirteenth year, we decided to concentrate on the top end of the market, catering to those who are okay with paying a higher price for superior goods. The decision was based on several considerations, including an examination of the market and an examination of how the competition is doing. We saw an opportunity to fill a niche in the luxury market, where we knew we could provide superior quality design in Europe and Africa.
The choice paid off well, as our revenue and profit both shot up when it was implemented. After executing our new approach, our market share in the luxury sector was toping among the competitors in Europe and Africa, as seen in Figure 3 below. Several valuable life lessons also emerged from our BSG endeavours. The need to not keep our strengths and differentiators was highlighted as a significant insight.
Year 14
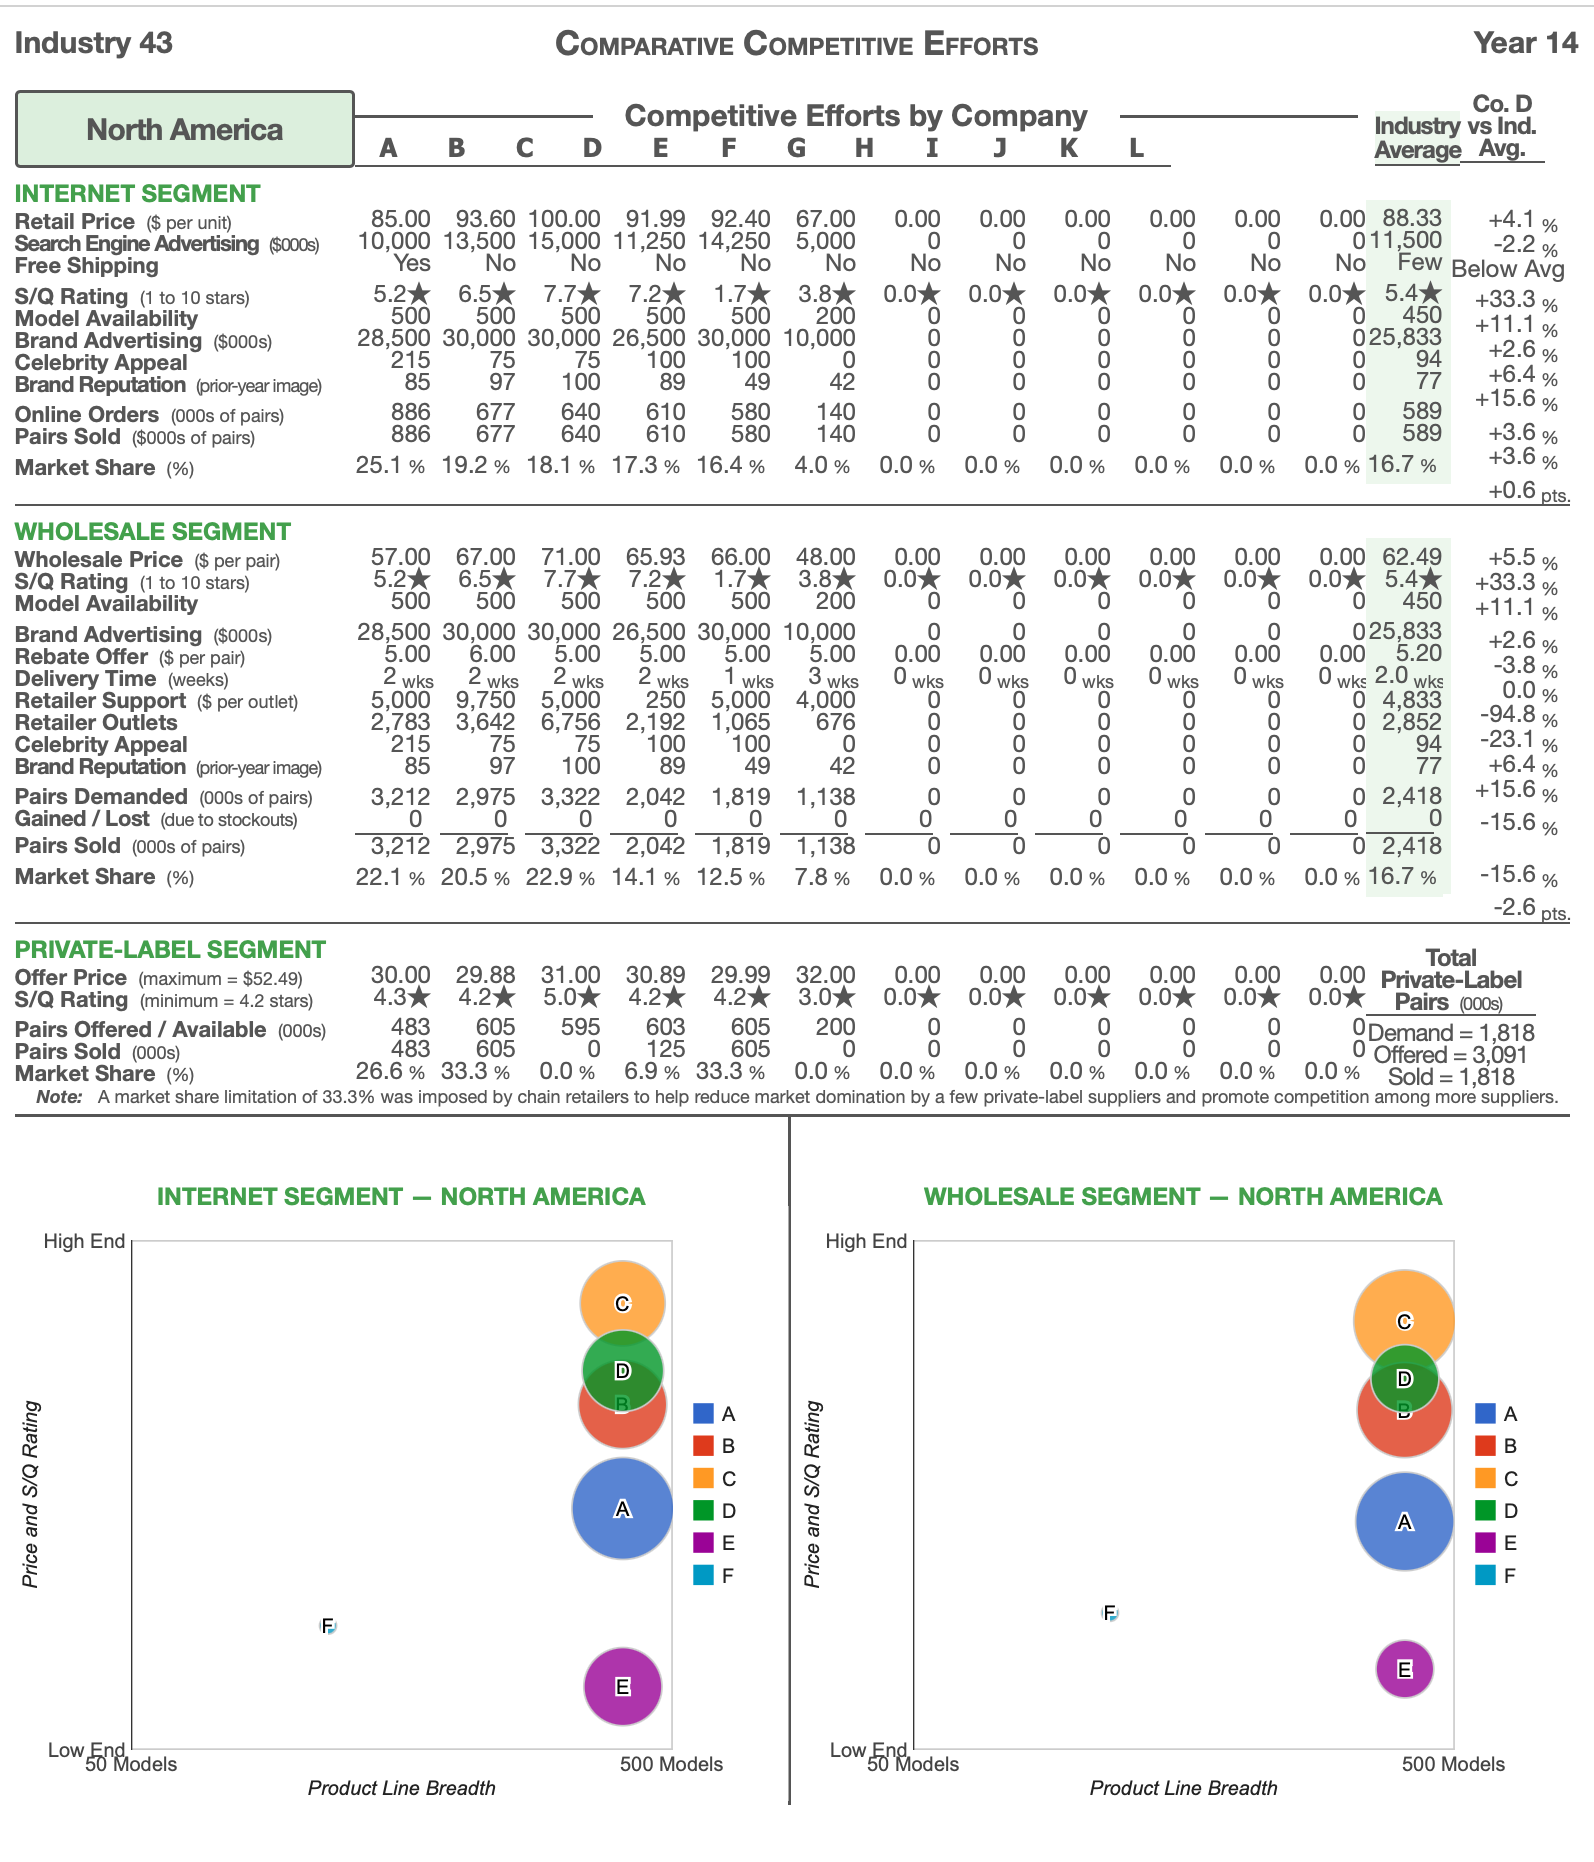
In Year 14, we made the deliberate decision to go ahead with our #2 competitor in North America and seize the lead in the market. Along the road, we made a lot of decisions, and each one was impacted by a different set of circumstances, but they were all made with the final goal in mind. Conditions in the market, the achievements of competing businesses, and the results of an internal study all played a part. When making our calls, we took into consideration what we would get from the previous rounds.
Increasing our marketing and development activities was a significant choice we made. We poured resources into R&D to produce cutting-edge items that would sell well in our niche. We invested more in advertising and made an effort to raise brand recognition via various mediums, which increased the brand’s popularity in North America, as depicted in Figure 4.
In addition, we increased our market share by making intelligent acquisitions to grow our company. We purchased a well-established, smaller company in a specific industry subset to expand our client base and increase revenue. From our time in the BSG, we learnt that thinking about the big picture while making decisions is crucial. In order to make intelligent choices, we had to think about many different things, including the state of the market, how our competitors were doing, and how we were doing as a company.
Year 15
In the fifteenth year of our company’s existence, we took the pivotal decision to place an increased emphasis on research and development of new goods. After providing the appropriate amount of attention to both internal and external factors, such as the current state of the market and the activities of our rivals, we came to this decision. We saw that our competitors were gaining market share as a result of the innovative solutions they were providing; as a result, we decided to invest in research and development to guarantee that we would always be one step ahead of the competition (Safitri et al., 2019). After assessing our skills, we determined that the development of products was a potential prospect.
As shown in Figure 5, the consequences of our choice led to an increase in our earnings per share, which went from $3 in the year before to $5 in the year after. This happened as a result of the launch of a number of game-changing new products that not only wowed our customers but also provided us with an edge in the competitive marketplace. As a result of this experience, we came to the conclusion that investing in research and development is essential to maintaining our competitive edge. We also understood the need to carefully follow advancements in the industry as well as those of our competitors in order to locate gaps in the market that we might fill.

Year 16
We invested in superior raw materials and technology to improve product quality. We optimized manufacturing to save costs and boost efficiency. Our average selling price and profit margins increased. Targeting specific client demographics and generating focused advertising campaigns increased our marketing efforts (Liu et al., 2018). This boosted sales and market share.
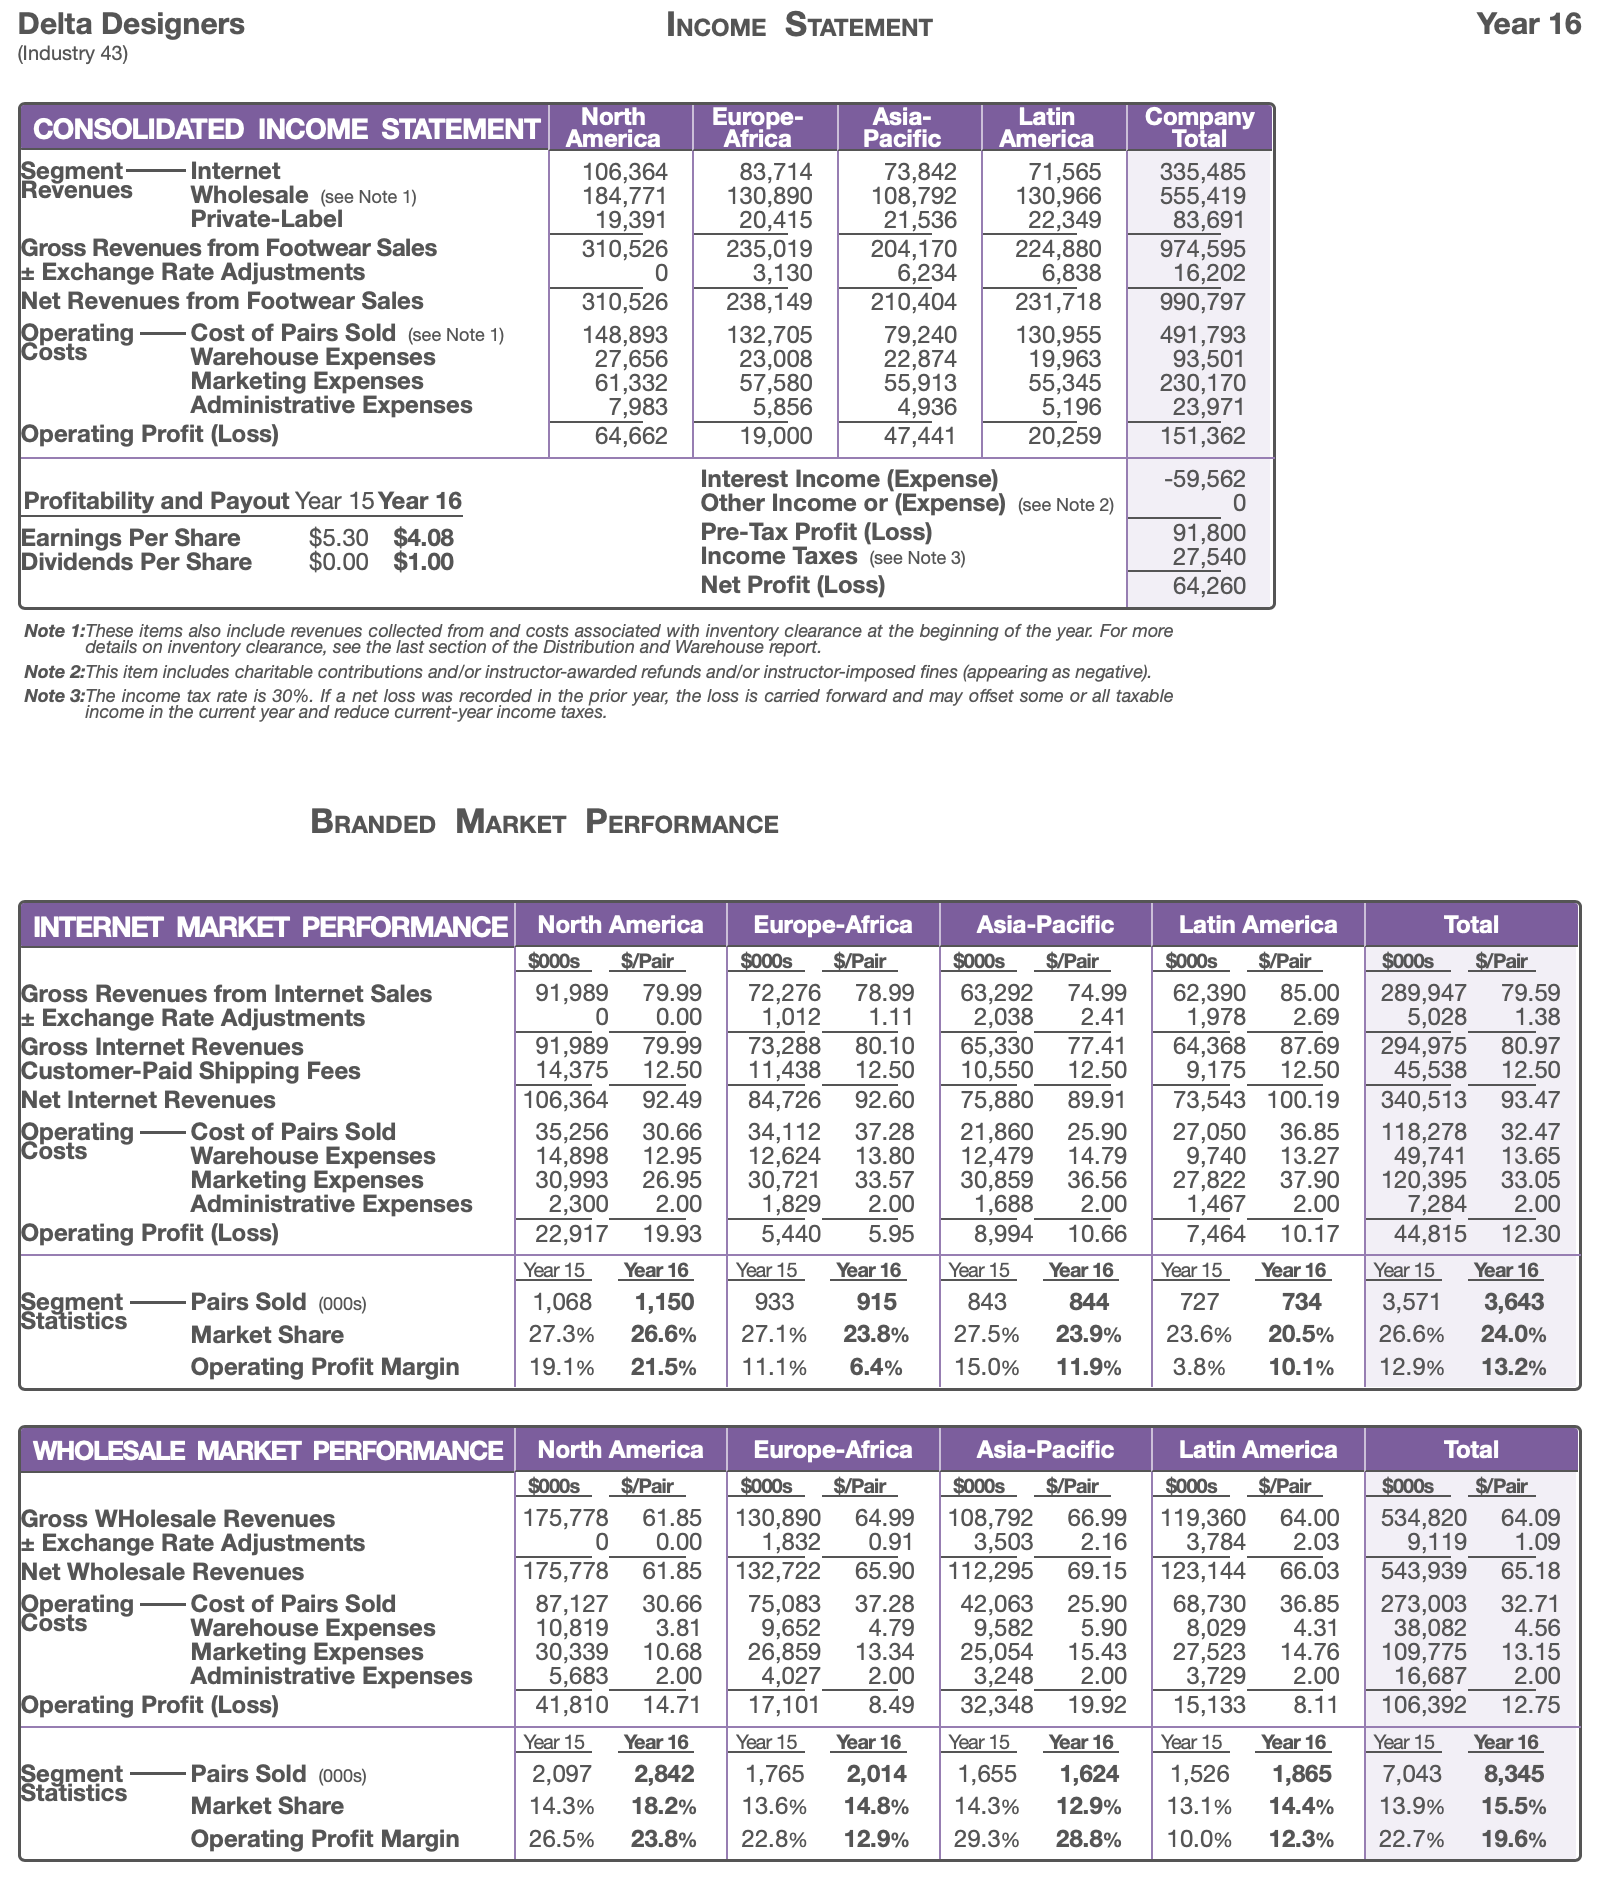
We optimized our distribution networks by streamlining logistics and working with trusted shipping providers. This reduced transportation expenses and improved delivery times, where the operating profit margin increased from 12.9% in year 15 to 13.2 in year 16, as indicated in Figure 6. These choices were based on market trends, competitive performance, and internal capabilities. We regularly researched customer preferences and trends and watched our rivals for dangers and possibilities. Our choices were successful. Revenue, market share, and operational profit rose.
The Impact of an Emerging Technology on the Future BSG
Technologies that are still in their infancy yet have the potential to create whole new markets are considered emerging technologies. Examples of emerging technologies include artificial intelligence (AI), blockchain, augmented reality (AR), virtual reality (VR), and the Internet of Things (IoT) (Kumar et al., 2019). Shoe manufacturer Delta Designers Shoes Wear has a lot riding on the success of emerging technologies like 3D printing (Shahrubudin et al., 2019). Three-dimensional printing (also known as additive manufacturing) follows digital models to create physical objects by layering various materials
The future of the shoe industry may be drastically altered by 3D printing. The production of shoes has traditionally been a time-consuming and labour-intensive process involving several stages of cutting and stitching. By eliminating manual assembly requirements, 3D printing might reduce shoe production costs. Complex shoe designs are only one benefit of 3D printing for the footwear industry. However, 3D printing has unique challenges in the footwear industry.
One significant challenge is the limited supply of materials for 3D printing (Goh et al., 2020). The plastic that is the standard material for 3D printing is not suited for producing high-quality shoes. Moreover, it may be difficult for small and medium-sized businesses (SMEs) to afford the initial investment in 3D printing equipment and technology.
Future leadership at a shoe manufacturing company like Delta Designers Shoes should consider the following recommendations to make the most of the opportunities presented by 3D printing while addressing its constraints.
- Invest in R&D to expand the range of 3D-printable materials, especially those used to create footwear.
- Create partnerships with industry leaders in 3D printing to pool resources and split the cost of cutting-edge R&D.
- Prioritizing shoe personalization with 3D printing technology will help the firm stand out from competitors and increase customer loyalty.
- Ensure your company has the skills necessary to reap the benefits of 3D printing by training and employing experts in the field.
Conclusion
As measured by EPS, Delta Designers’ success throughout the years has been uneven. For a freshly founded firm, the $2 in earnings per share the corporation recorded in its 10th year may be below investors’ expectations. In year 11, however, the business reported a massive increase in performance, with an EPS of $5 that may have surprised investors. Delta Designers’ earnings per share (EPS) in year 12 was $3, down from $4 in year 11, but in line with market forecasts. The company’s earnings per share (EPS) in year 13 climbed to $3.5, an uptick. The company’s EPS dropped to $2.5 in year 14, which may have disappointed investors, as indicated in Figure 7.
With earnings per share of $5.5 in its 15th year, the corporation may have surpassed investor expectations. In year 16, the company’s earnings per share dropped to $4, which was in line with market forecasts. In general, Delta Designers’ actual results were uneven compared to its investors’ expectations. In specific years, the company’s performance matched or exceeded analysts’ forecasts. Changes in market circumstances, levels of competition, and tactical choices made by the corporation may all have a role in the periodic ups and downs of earnings per share (Nurjanah & Nurcholisah, 2021). Before putting their money into a firm, investors should consider the above and the road ahead for the business.

Reference List
Abaidoo, R. and Agyapong, E. (2021) “Macroeconomic risk and political stability: Perspectives from emerging and developing economies,” Global Business Review. Web.
AlShamsi, S. and Nobanee, H. (2020) “Financial Management of Climate Change: A mini-review,” SSRN Electronic Journal [Preprint]. Web.
Benzaghta, M.A. et al. (2021) “SWOT analysis applications: An integrative literature review,” Journal of Global Business Insights, 6(1), pp. 55–73. Web.
Business Strategy Game (2023) The Business Strategy Game – competing in a global marketplace, The Business Strategy Game – Competing in a Global Marketplace. Web.
Georgiadou, E. et al. (2019) “A steepled analysis of the SPI Manifesto,” Communications in Computer and Information Science, pp. 209–221. Web.
Goh, G.D., Sing, S.L. and Yeong, W.Y. (2020) “A review on machine learning in 3D printing: Applications, potential, and challenges,” Artificial Intelligence Review, 54(1), pp. 63–94. Web.
Haseeb, M. et al. (2019) “Role of social and technological challenges in achieving a sustainable competitive advantage and sustainable business performance,” Sustainability, 11(14), p. 3811. Web..
Ibrahim, S., Nurrochmat, D.R. and Maulana, A. (2019) “Analysis of Footwear Business Development Strategy Using QSPM and SWOT analysis,” Leather and Footwear Journal, 19(4), pp. 167–176. Web.
Isabelle, D. et al. (2020) “Is Porter’s five forces framework still relevant? A study of the capital/labour intensity continuum via mining and IT industries,” Technology Innovation Management Review, 10(6), pp. 28–41. Web.
Kumar, S. et al. (2019) “Additive Manufacturing as an emerging technology for fabrication of Microelectromechanical Systems (MEMS),” Journal of Micromanufacturing, 2(2), pp. 175–197. Web.
Liu, X.(K., Liu, X. and Reid, C.D. (2018) “Stakeholder orientations and cost management,” Contemporary Accounting Research, 36(1), pp. 486–512. Web.
Liu, Y., Jiang, C. and Zhao, H. (2019) “Assessing product competitive advantages from the perspective of customers by mining user-generated content on social media,” Decision Support Systems, 123. Web.
Niemimaa, M. et al. (2019) “Business continuity of business models: Evaluating the resilience of business models for contingencies,” International Journal of Information Management, 49, pp. 208–216. Web.
Nurjanah, I. and Nurcholisah, K. (2021) “Pengaruh earning per share Dan Deviden per share Terhadap Harga Saham,” Jurnal Riset Akuntansi, 1(2), pp. 76–81. Web.
Pan, W., Chen, L. and Zhan, W. (2019) “Pestel analysis of Construction Productivity Enhancement Strategies: A case study of three economies,” Journal of Management in Engineering, 35(1). Web.
Safitri, V.A., Sari, L. and Gamayuni, R.R. (2019) “Research and development, environmental investments, to eco-efficiency, and firm value,” The Indonesian Journal of Accounting Research, 22(03). Web.
Shahrubudin, N., Lee, T.C. and Ramlan, R. (2019) “An overview on 3D printing technology: Technological, materials, and applications,” Procedia Manufacturing, 35, pp. 1286–1296. Web.
Suwanda, S. and Nugroho, B.Y. (2022) “Literature reviews: McKinsey 7s model to support organizational performance,” Technium Social Sciences Journal, 38, pp. 1–9. Web.