Abstract
Spectroscopic methods are a natural adjunct to chemical analysis, allowing for a quantitative and qualitative investigation of substances with unknown characteristics. In this report, it was explained how the use of the Beer-Lambert spectroscopic law allows determining the concentration of the active ingredient in medicinal products, which, moreover, was the central purpose of the work. The search for results was accompanied by a mathematical calculation of approximating linear model, construction of calibration straight line, and calculation of errors of concentration. The work combined methods of both manual calculation of secondary data and the application of automatic estimates by means of MS Excel software. Since the linear regression showed a high accuracy of compliance with the primary data — it is approximately equal to 1 — this model has been used to determine unknown concentrations of measured samples. The overall results show that the actual concentrations of the active ingredient in the five medicinal products of Drug Company Q do not match the declared values. In particular, the calculation showed that the error for sample M21050-2 compared to the declared concentration exceeds 57%, which is an unacceptable failure for the pharmaceutical industry. At the same time, none of the concentrations were found to fit within the legally defined range of values.
Introduction
Analytical methods of quantitative identification in a scientific laboratory are not limited to studies of intermolecular chemical interaction but can also consider statistical forces implemented within substances. A serious group of methods with significant research weight is spectroscopic technologies. The general idea of almost all optical measurements of chemical molecules or atoms is based on the idea of registering radiation due to the internal vibrations of particles. Thus, using spectrophotometers, specialists can not only identify a particular type of substance but also determine its concentrations.
A meaningful part of spectroscopic calculations for chemical analysis is based on the use of the Beer optic law, or Beer-Lambert, to quantify the absorption of substances. It should be specified that the Beer law is a standard physical law determining the attenuation of a parallel monochromatic beam of electromagnetic radiation when propagating in an absorbing medium. In other words, this model defines the relationship between the physical and chemical characteristics of the material and the penetration of light through it. The mathematical notion of the law is depicted in a standard way as follows:
A = εcι
where A is the absorbing capacity of the substance, ε is the molar absorption index, l is the optical path length, and c is the molar concentration of the reference substance (“The Beer-Lambert law,” n.d.). In general, it is not difficult to notice some physical regularities peculiar to the Beer law. First of all, it concerns linear dependencies conditioned by formula (1): the thicker is the solution layer through which the electromagnetic radiation beam passes, and the higher is the substance concentration, the higher is the optical density of the solution, A. Hence, less light can pass through the object under study. In summary, this means that by measuring the amount of light that passed through the medium, the expert can predict the concentration of matter in the original sample.
The experimental cornerstone for conducting spectroscopic measurements is based on the use of a calibration straight line model that combines the absorption of substance, A, and concentration, C. In particular, by measuring parameter A for several test samples with a known concentration, a specialist can set conditions for the relationship between the values and determine the calibration equation, which will then be used to detect the concentration of a substance with a pre-registered absorption.
Data Analysis
This research may be classified as secondary processing of primary data provided to the student in advance. More specifically, on the basis of two tables describing the concentration and absorption capacity of substances, calculations were made, and a calibration plot was constructed to determine unknown concentrations of over-the-counter drugs. Table 1 contains information on five drug test samples including the active ingredient M: identification code, molecular concentration, and measured absorption capacity.
Table 1: Recorded data on five test drugs produced by Drug Company Q.
The concentration-dependent absorption data were used to mathematically estimate the straight line equation satisfying the points, as shown in equation (2). Equation (4) was shown to be a satisfactory model for data approximation with a determination coefficient of 0.9999. On the basis of the automatic calculations performed in MS Excel, a calibration graph (see figure 1) was constructed showing the linear consistency of the values.
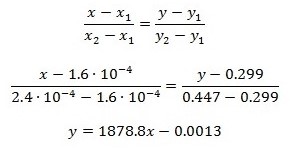
Figure 1: Calibration chart of dependence of absorbance on concentration for active substance.This information was subsequently used to quantify the unknown concentrations of the five sample substances described in Table 2. From the measured drug absorption and Figure 1, concentration values — which was variable x — were determined. The substitution of known values in equation (4) allows to determine the required values. Data on concentrations of these substances are reflected in Table 3.
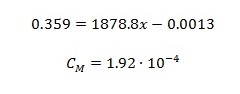
Table 2: Summarized information about the absorbance of five over-the-counter drugs
Table 3: Consolidated information on concentrations of five over-the-counter drugs
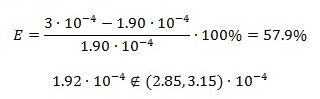
For the pharmaceutical industry, it is crucial to determine the level of consistency between the developed formula and those values that have a favorable expected result for the patient’s health. Any deviation from the rate can be interpreted as a conscious error in favor of saving production costs or seeking to mislead the consumer. At the same time, it should be recognized that some relatively low error values can be considered as typical errors, nevertheless, satisfying the confidence interval. For this reason, the mathematical evaluation of the error is the first step in postoperative processing. In pharmaceutical laboratories, it is necessary to have regular output quality control that regulates the error of procedures. That is why additional data processing included a statistical evaluation of the error between the measured values and those offered by the company and an evaluation of the legality of concentrations detected by the Beer spectroscopic method. In particular, the error calculation was based on the terms that the company reported the concentration of the active ingredient M in sample M21050-2. The calculation reflected in equation (6) showed that the error of such data exceeds 57%. At the same time, the estimation of the legitimacy of real concentrations was accompanied by a comparison of calculated values with official ones, as shown in equation (7).
Conclusion
Spectroscopic methods are crucial for chemical analysis, as their application dramatically simplifies the task of quantitative determination of concentrations of solutions under study. As a result of this laboratory work, it was shown that the use of the Beer-Lambert law is acceptable for the task of searching for concentrations if this procedure was preceded by the construction of a calibration plot. The linear regression model has been applied to the primary data in order to search for mathematical interdependence of absorbance and concentration. Based on data on five drugs, it was shown that samples with unspecified concentrations do not meet official regulations due to the reduced content of the active substance. Moreover, the percentage of error was shown: the pharmaceutical company Drug Company Q is wrong by more than 57%, claiming that their drug concentration falls within the established allowable limits.
Reference
The Beer-Lambert law. (n.d.). Edinburgh Instruments. 2020, Web.