Introduction
In today’s increasingly competitive and high-paced educational and working environment it can be very difficult for students to make a good decision as for the choice of their primary major. For this reason, there exists a phenomenon of changing academic majors, which can have both a positive and negative impact on the output quality of education. On the positive side, switching the primary field of study can bring an individual towards a better career fit and also promote exploration.
On the negative side, changing a major can contribute to the higher overall cost of studies and the failure to graduate on time. However, one of the fundamental KPIs of the educational process is whether students manage to graduate from their program overall, which is essential both for the positive self-image and the person’s earning potential.
Exploring the association between switching a major and graduation can be important for a number of reasons. First of all, this can help to understand whether the state and local governments should encourage or discourage such behaviors by designing appropriate policies. Secondly, this could set a proper vector in establishing the field of research on the costs of switching majors for individuals, society, and the educational system. This type of analysis can be specifically relevant for the specializations in which students with lower than average grades are most likely to change majors (Sklar 47), such as for instance the set of science, technology, and engineering (STEM) specializations.
With the view of the above, the thesis statement for the paper can be formulated as follows:
- College students who change their major are less likely to complete their degree vs. students who remain in their originally selected major.
The estimation of the above thesis statement will be made empirically with the help of the quantitative methods of statistical research.
Research Methods and Descriptive Statistics
The data for the considered sample was collected with the help of an internet survey distributed to students containing two major questions. The first one of them was “Have you ever switched majors throughout your studies?” with the yes / no options of answers. The second one was “On a scale from one to ten (from not likely at all to very likely, respectively), what is your estimated probability to successfully graduate?”. The latter measurement method is called a Likert scale and is applied to qualitatively represent ordinal variables in statistical research.
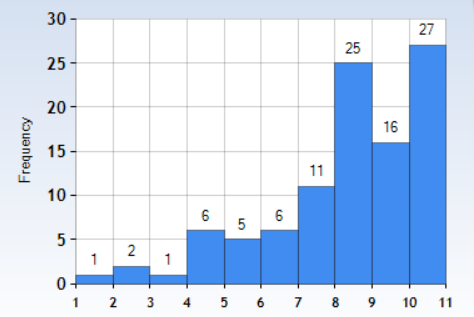
It can be seen that the number of observations for the individuals who switched majors is 50, while the group of non-switching students is two times bigger. The minimum value for both samples is 1, and the maximum value is 10. The average for the self-reported probabilities of graduation is 4.22 for the students who switched majors and 7.84 for the students who haven’t switched. This preliminarily confirms the thesis claim that the mean for the major switch group is lower. The standard deviations reported in the table reflect how far the values of observations of the sample are spread around the mean. It can be seen that the two groups have almost similar standard deviations, with the higher variation associated with the group that changed majors (2.44 versus 2.12).
Figure 1 shows the frequency histogram for the subsample with a switch of majors, and it can be seen that the distribution is skewed to the right. This means that there are smaller values of self-reported probabilities.
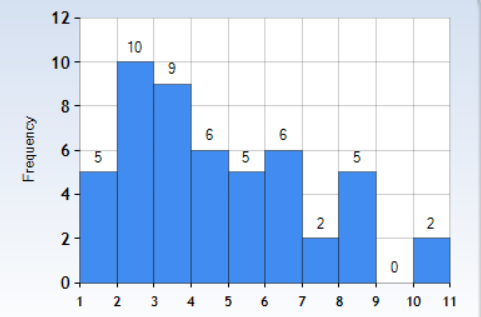
Figure 2 shows the frequency histogram for the subsample without a switch of majors, and it can be seen that the distribution is skewed to the left, which more of larger values of self-reported probabilities.
The two methods that will be used to explore the claim of the thesis statement are hypothesis testing and confidence interval analysis. The hypothesis testing will be performed with the help of an independent samples t-test.
Results
The first method to be used in exploring the thesis statement is the confidence interval analysis. The general formula for calculating the confidence interval for the difference in means is as below:
The confidence interval for the difference in means between the two considered subsamples is as follows:
 = 3.62≠0.64
 Therefore, the lower bound of the confidence interval is 2.98, and the higher bound is 4.26. This means that it is possible to be 90% confident that the difference between the two population means falls into this interval. Given that this interval does not contain zero and is positive, this confirms the thesis statement of higher self-reported probability to graduate for those who haven’t switched majors.
The second method of statistical analysis to be used is hypothesis testing. The null hypothesis is that the mean of the population that switched majors is either equal to or higher than the mean of the other group. The alternative hypothesis is that the mean of the population that switched majors is lower than the mean of the other group (therefore, this is a one-sided hypothesis). The formula for the respective t-test is as below:
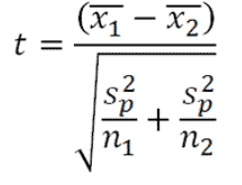
For the specific case of the two samples:
sp = (49/148) * 5.93) + ((99/148) *4.48) = 4.96
 = 9.38
The associated p-value from tables or the statistical calculator is equal to 0.000, and therefore it is possible to reject the null hypothesis at 90% (p-value is lower than 0.1). This means that the initial thesis of lower self-reported probability to graduate for people who changed majors is confirmed.
Conclusion
Within the current study, the focus was made on exploring whether the change of the major of study has an impact on the self-reported probability to successfully graduate. Having conducted hypothesis testing and confidence interval calculation procedures, it was found that indeed the probability of graduation is higher for the group which didn’t change major. This confirms the initially constructed thesis statement and can affect the world in the way that more policies are constructed either to discourage switching of majors or to make this process more efficient for students.
In order to make the current study better, it would be beneficial to conduct multivariate regression analysis with the probability to graduate as a predictor and the switch of major as a predicting variable (probably transformed into the dummy form). A number of additional independent control variables should also be included in the equation. This will help to eliminate the omitted variable bias which can obscure the statistical significance of variables and the effect size.
For future research, it could be beneficial to conduct a fixed effects regression analysis which would incorporate a sample for different specializations and different years (a panel dataset). This can be relevant as the major switches and probability of graduation can be related differently across specializations such as arts, STEM, or social sciences. In addition, some objective measures of graduation rates can be used instead of the self-reported estimates.
Work Cited
Sklar, Jeffrey C. “Event History Analysis for Investigating the Likelihood and Timing of Changing Majors.” The Journal of the National Academic Advising Association, vol. 38, no. 1, 2018, pp. 47-60.