Introduction
Proteomics is known to be the study of proteins considered to be the essential part of living organisms. This interdisciplinary domain covers the exploration of proteomes, also referred to as sets of proteins produced by a biosystem. Several methods to generate proteomic data, such as gel-based proteomics and mass spectrometry-based proteomics, are detailed further (Angel et al., 2012; Schmidt et al., 2014). The existing methods to analyze the obtained data are also critically evaluated below, including mass spectrometry data analysis, GO Term identification, pathway analysis, and analysis of protein-protein-interactions.
The Methods to Generate Proteomic Data
Detecting and quantifying thousands of protein isoforms present in a biological sample is a complex task, from an analytical perspective, which is assisted by means of liquid chromatography (LC) and mass spectrometry (MS) working collaboratively (LC-MS based characterization). To begin with, it is possible to provide an example of bottom-up proteomics analysis in the Figure 1 below, including stages from protein extraction to identification, quantification, and knowledge integration. The last three ones are considered means of analysis rather than generation are discussed in the following section of the paper.
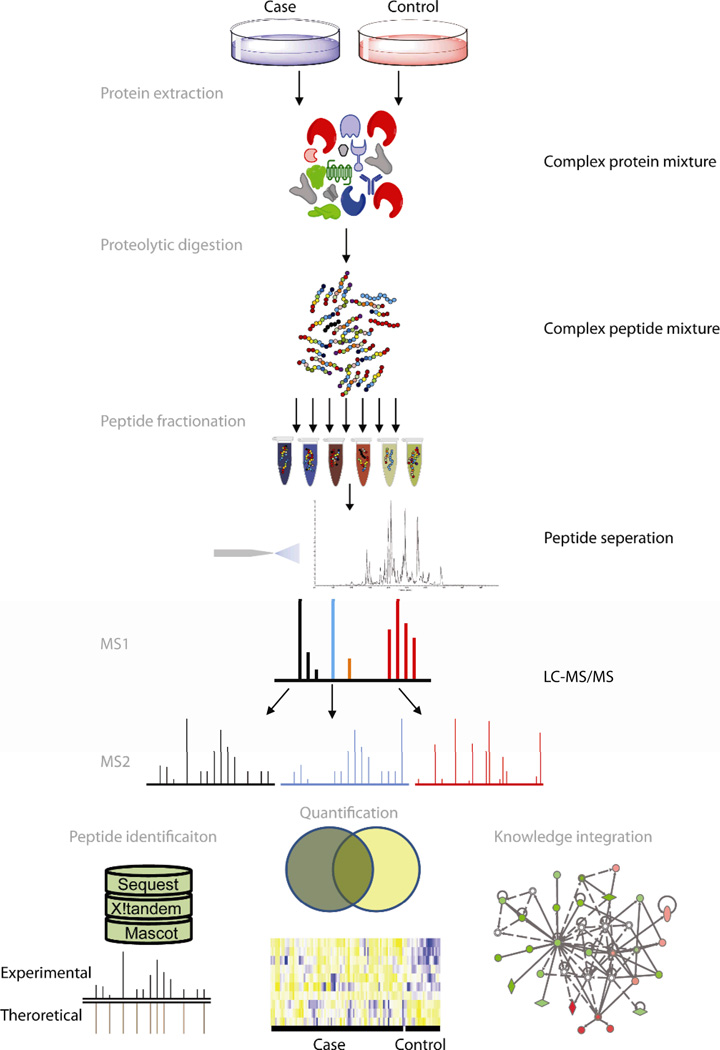
The last three sections are considered means of analysis rather than generation are discussed in the following section of the paper. With respect to the steps of data generations, it begins with isolating a mixture of proteins and enzymatically or chemically cleaving it into peptides (Angel et al., 2012). Then, the mixture is fractionated using chromatography or other methods, followed by stages of reversed-phase chromatographic separation, ionizing by electrospray ionization, and analyzed by means of MS. LC/MS also involves the acquisition of a preliminary mass spectrum of the intact peptide, dissociation of the isolated precursor ion, and subsequent mass analysis of the fragments. The limitation of this method is the impossibility of comprehensive proteome coverage of biofluid because one dimension analysis does not fall into the required range of detection.
The second method of proteomic data generation is the gel-based approach, known as the highly prevalent and versatile global protein separation and quantification method. Its simplified overview with steps outlined is provided in Figure 2.
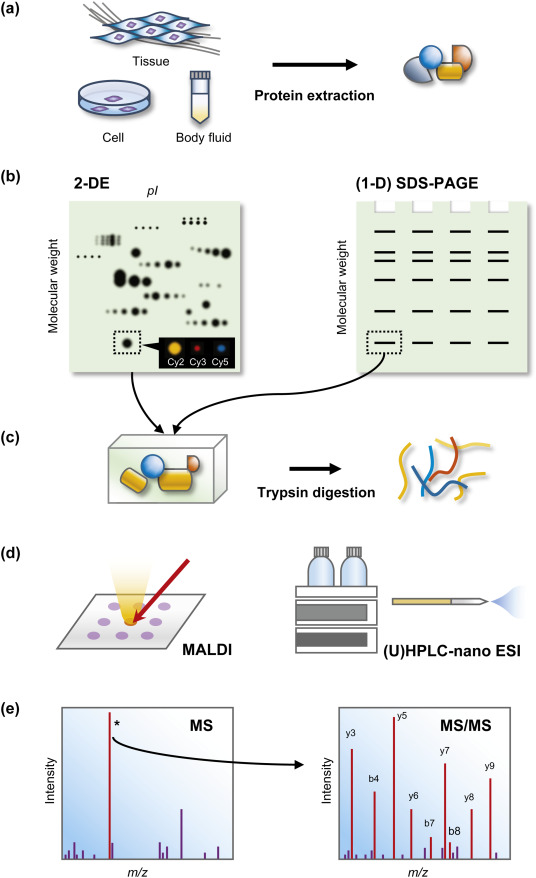
The steps involved are protein solubilization that includes cell disruption, denaturation, reduced to disrupt intermolecular interactions, and solubilization using a buffer with chaotropes. Then, the first dimension that is isoelectric-focusing with immobilized pH gradient (IPGs), is achieved (Kim & Cho, 2019; Chevalier, 2010). It is done by a fry gel formed by polymerization of acrylamide monomers linked with immobilins. The strip acrylamide gels are dried and cast on a plastic backing and are saturated with sodium dodecyl sulfate (SDS) in the equilibrium step. Then, the second dimension, known as SDS polyacrylamide gel electrophoresis, is achieved. It implies separation denatured and reduced proteins by their molecular weight (Kim & Cho, 2019; Chevalier, 2010). Gel staining, which is the following step, involved immersing of gel in a fixation solution containing acid and applying fluorescent or any other recommended dyes. Then, methods of bioinformatic analysis of 2D images and protein identification can be implemented (Kim & Cho, 2019). The limitations of this methods are membrane proteins, low-abundance proteins, alkaline proteins, and high molecular weight proteins, while the method is considered sufficient for protein isoforms.
The Methods to Analyse Proteomic Data
After all the steps intended to gather proteomic data from a mixture are passed, the following methods to examine the information obtained, known as bioinformatic analysis, can be implemented. Mass spectrometry data analysis that continues the shotgun/discovery approach outlined above enables to find out a certain peptide’s intensity and obtain the corresponding chromatographic peak. Using the protein databases, the identification of thousands of proteins with a dynamic range of 104-105 is possible. Another way of functional interpreting can be GO Term identification, intended to connect the protein identifier with its associate Gene Ontology terms (Schmidt et al., 2014). The step of enrichment done after GO Term identification enables the comparison of the abundance of specific GO-terms in the dataset with the natural abundance in the organism in the reference dataset (Schmidt et al., 2014). Modular enrichment analysis prevents the loss of biological correlations while using algorithms for identifying proteins.
Pathway analysis is referred to as using databases to extract pathway constraints from biological data and discovering GO term associations of independent proteins. Similar to Go term annotation, pathway identification is based on algorithms used to correlate found dependencies with artificial datasets (Schmidt et al., 2014). Finally, protein-protein-interactions is the analysis of large interaction networks illustrating the high degree of connectivity indicating the presence of promiscuous hub proteins. An interaction database is used for drawing simple protein networks based on the provided gene lists, thus creating pathways and function maps needed to reveal a large fraction of observed proteins.
References
Angel, T. E., Aryal, U. K., Hengel, S. M., Baker, E. S., Kelly, R. T., Robinson, E. W., & Smith, R. D. (2012). Mass spectrometry-based proteomics: existing capabilities and future directions. Chemical Society reviews, 41(10), 3912–3928. Web.
Chevalier, F. (2010). Highlights on the capacities of “Gel-based” proteomics. Proteome Sci, 8(23). Web.
Kim, Y., Cho, J. (2019) Gel-based proteomics in disease research: Is it still valuable? Biochimica et Biophysica Acta (BBA) – Proteins and Proteomics, 1867(1), 9-16. Web.
Schmidt, A., Forne, I. & Imhof, A. (2014). Bioinformatic analysis of proteomics data. BMC Syst Biol, 8(S3). Web.