Introduction
A map is an actual representation in a diagram of an area of land with a detailed illustration of key features, cities, roads, and other physical elements. Also, the map entails symbolic projection and depiction of actual elements in the ground while maintaining actual spaces between objects. A map signifies exact distances, spaces that exist between the objected representation of the ground. The usage of maps has increased from directional purposes to representative roles of vital phenomena informing of a population characteristic. This paper will largely focus on representing the New York map to show a syndicate-evaluated crime network in New York City.
Additionally, the maps will play an instrumental role in indicating neurons springing’s of New York. It will also cover an analysis of the population both within the city and externally. Particularly, the crime rate within the represented section of the maps forms the basis of the analyses.
New York and Crime
As a crime city, New York City has been characterized by evolving population throughout its historical development, which takes the form of the globalist. For instance, the emergence of settlement resultant in eruptions of business and similar disruptions from the crime world. The spike in crime rate within New York City has been traced back to about 1980 and early 1990s. This was the period that the city experienced its works regarding crime. For instance, increased criminal actions resulted in several losses of properties and a spike in death rates. The emergence of gangs and gang-related organizations highly characterized this period—New York, the city with an average of 20 million individuals. The city experienced a rapid increment of toll related to criminal death due to police engagement. Prevention programs to curb the criminal offenses resulted in mapping the city based on the crime. In relation to other determinants of policy, the NYPD played an instrumental role in providing data for the mapping respectively. As a result, a well-validated map was postulated as represented above to map out the key regions which encountered works cases of crimes in New York.
Arguably, the maps were developed to connect the various police department units within New York City. For instance, NYPD, SWAT, and DEA formed the largest portion of the mapping of the crimes within New York. The actions of the key police department with the help of other branches of the police highly enhanced the capability of efficient representation of the city’s crime geographically.
The map was made through that location provision that resulted from various police departments regarding crimes. For instance, numerous police departments availed their locational data regarding the crime, and the data were combined and well represented with the help of mapping tools. further analytical tools were utilized to evaluate the intensity and degree of varying representation of crime relayed data
The New York crime map was developed to analyze and represent key crime spots statistically supported by investigations to facilitate prevention mechanisms. The map will benefit the police force while planning and allocating their teams into the region. Also, the map will facilitate the DEA’s syndicate operation by establishing control points and vintage points to earmark their operations regarding drug-related crimes (Timothy, 2020). Furthermore, the map will enhance the capability of both SWAT and NYPD to thwart and prevent instances of crime by providing enforcement to regions highly susceptible to criminal instances.
Additionally, the map will highly benefit the entire civilian due to crime reduction. Such will restore sanity in New York City and mainstream safe operations across the city’s key towns. In short, the reliability of the crime map mainly forms the correctional basis of the crimes (Sutherland et al., 2021). Truthful representation of actual crime-related inferences highly ignites the police actions to curb the crime. Such a map is instrumental as it results in the decline of crime-related activities.
The Crime Map of New York City
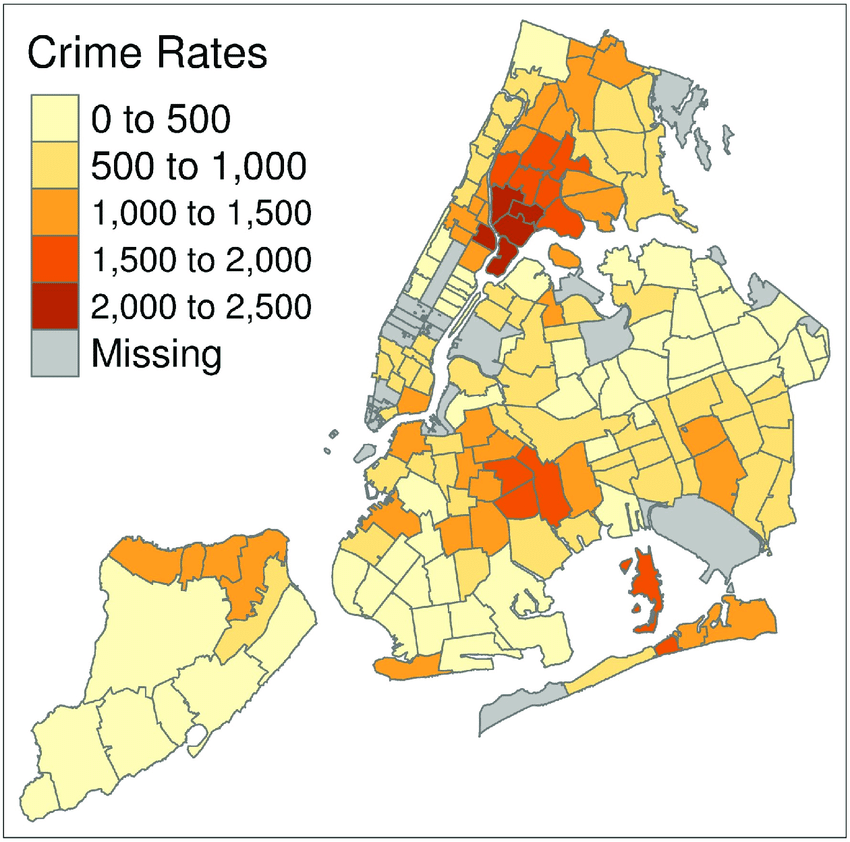
This map of the New York City is divided by the prevalence of reported Assault Crimes in the area. As seen with the legend attached, the crime is highlighted depending on the precinct and areas of the city, with darkly colored areas representing zones where more crime is reported. While the initial assessment of this map might indicate that certain areas of the city are more dangerous for particular reasons, statistics warrant a more nuanced discussion. In particular, the increased crime rates in specific areas can be connected with various demographic differences present in the city. Two of the most obvious ones are income and racial composition of New York Cities. The further discussion will attempt to understand the connection between the three factors, as well as the way in which their interaction can often be misunderstood.
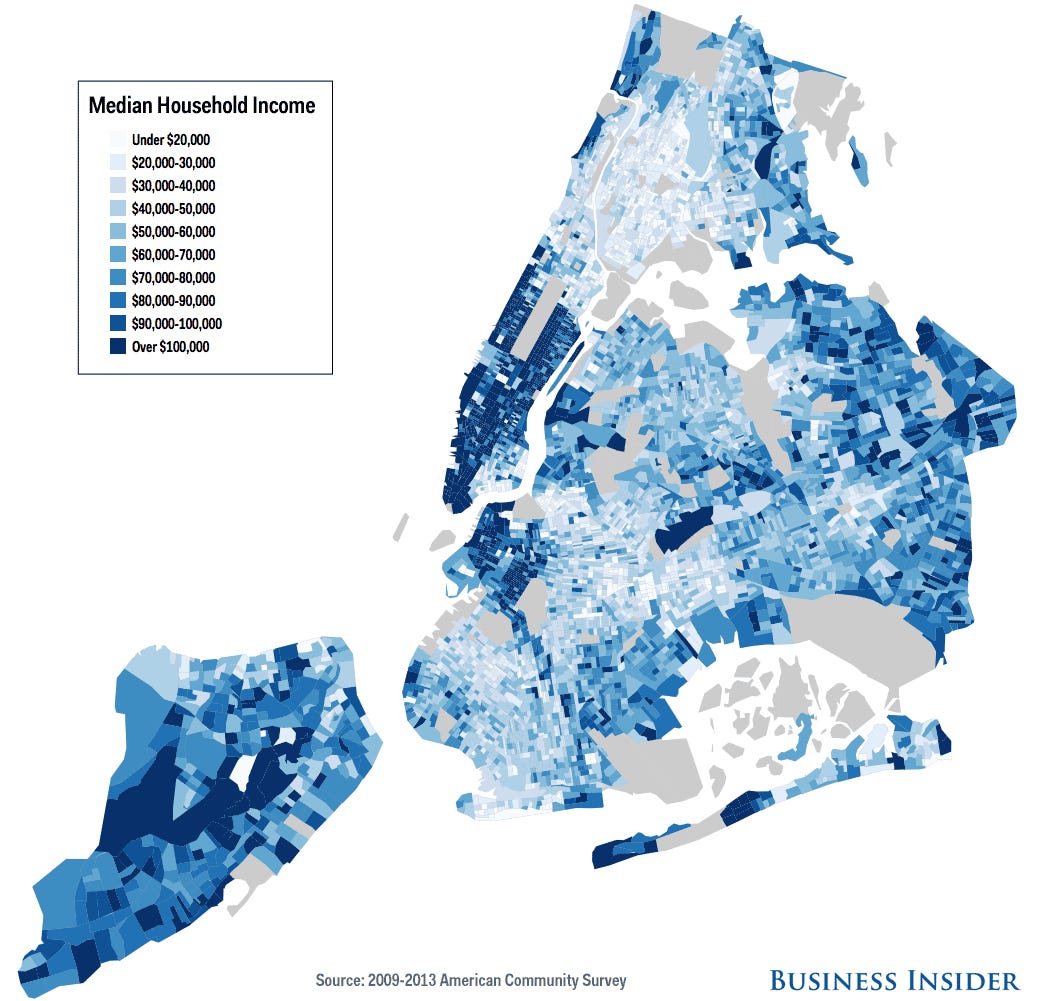
As presented on this particular map, the average income of households throughout the New York Cities can be seen. The areas where people earn and save more are sharded with a darker blue, making them distinct from other territories. While the geographical distinctions by income vary, the particular prevalence of richer families can be seen in certain places on the map. Interestingly, this map has a number of correlations with the previous one showcased. If the two are compared side by side, the viewer is able to notice that areas with increased assault cases are also the areas where the median household income is smaller. The correlation presents and interesting intersection between crime and poverty, showing that sociological factors have a direct impact on crime, and its prevalence in society. However, this is also not the only determining and important factor for this discussion. Another crucial comparison factor is race, which is one of the key considerations in the USA.
Culturally, New York City is a city with unmatched cultural attributes, this is due to the nature of the intervals that dwell in the region. For instance, the city boast its incredible larger and multi-ethnic culturally oriented population, which forms the global arena (Chamberlain et al., 2017). Arguably, the city encompasses individuals from across the world; hence, there are varying cultures. The occurrence of the cultural mix is highly manifested in how the entertainment sector conducts its performances within the city.
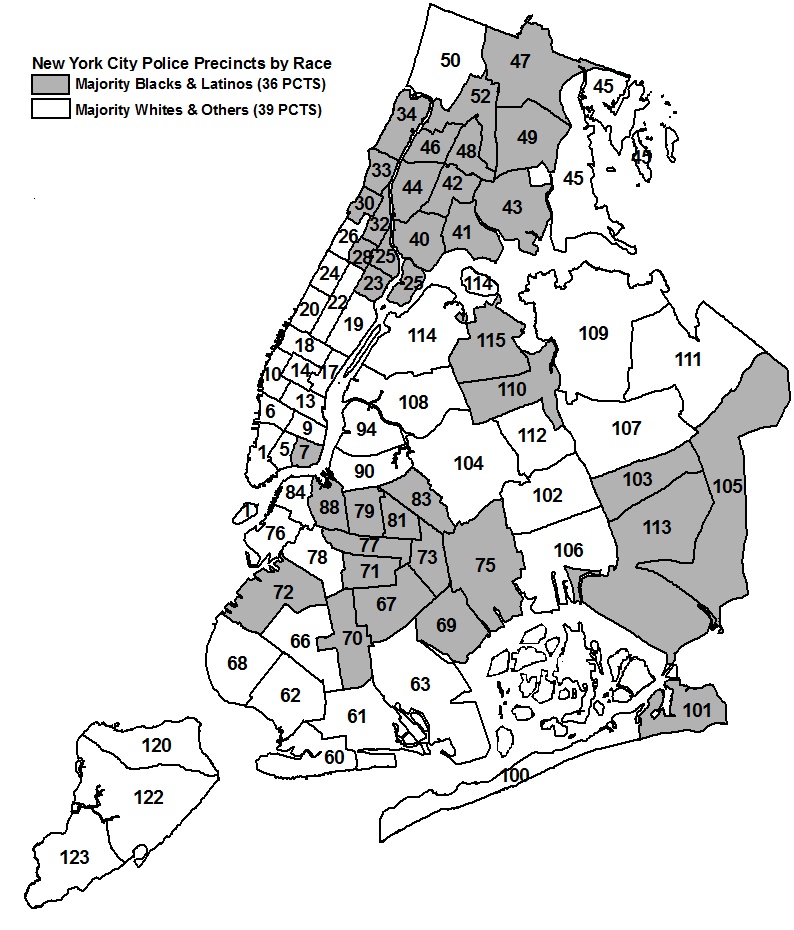
More importantly for this discussion, however, race also influences the prevalence of crime throughout the city. Similarly with the assault crime and income maps, the racial composition of the city is uneven. The congregation of racial minorities and people of color is seen in areas where crime is higher, and where income is generally lower. While this is not representative of all areas in the city, the general trend can be easily perceived. The connection between all three factors can lead the viewer to an number of conclusions.
The primary takeaway from this discussion should be that crime, race and income are intricately connected in society. Historically, areas of the United States where people of color lived have seen a larger percentage of crime. Importantly, however, such statistics are a result of the many systematic injusticies and differences between populations in the US. Areas with lower income in all nations are more likely to experience higher levels of crime. In the United States, however, these territories are more likely to be inhabited by people of color, which conflates their presence with the increased rate of criminality.
Additionally, the culture of redlining, and over-policing has determined the way law enforcement interacts with the residents of NYC. As seen by recent reports, increased police presence in areas where black people and other minorities live is still an existing problem in the city (Cipriano et al., 2020). The comparative percentage of the police in certain parts of the city leads to a larger percent of crime being reported there, which, in turn, leads to the creation of crime maps. The created distinctions of areas based on their crime rates, in turn, are often used to direct police action, leading to more policing and more crime being reported. Areas with higher income, where the population is historically more white get less police coverage. This system of crime reporting, prevention and counteraction creates systematic differences between precincts in the city.
Conclusion
Prevention programs to curb the criminal offenses resulted in mapping the city based on the crime. Culturally, New York City is a city with unmatched cultural attributes, due to the nature of the intervals that dwell in the region. The historical background of the city, and the country as a whole, has lended itself to systematic differences between regions. The tight connection between income, race and policing determines the public understanding of criminality, criminal reporting and current statistics (Cipriano et al., 2020). Certain areas of the city get more coverage in statistics regarding drug use, assault and other types of crime, which becomes a central factor in how they are treated in the future (The 75 Neighborhood-Based New York City Police Precincts By Marijuana Arrest Rates And Race). While discrepancies exist due to the differences in populations, cultures and income of people within the various precincts of NYC, a more critical engagement with data is necessary to contruct an accurate map.
References
Fatehkia, M., O’Brien, D., & Weber, I. (2019). Correlated impulses: Using facebook interests to improve predictions of crime rates in urban areas. PLOS ONE, 14(2). Web.
The 75 Neighborhood-Based New York City Police Precincts By Marijuana Arrest Rates And Race. Marijuana Arrests. (n.d.). Web.
Kiersz, A. (2014). Here’s a block-by-block look at WHO’s making how much across NYC’s 5 boroughs. Business Insider. Web.
Cipriano, A. (2020). ‘Overpolicing’ still common in NYC Black neighborhoods, report finds. The Crime Report. Web.