If there is a correlation between two variables that tends to be close to linear (that is, if one variable changes, the other also does so), this tendency can be demonstrated on a Cartesian coordinate system by drawing a straight line to which the data points converge. How scattered the data points are from this line is measured by the correlation coefficient, r (-1≤r≤+1). If r>0, then the values of both variables increase simultaneously; if r<0, when the value of one variable increases, the value of the other decreases; if r=0, there is no linear association.
The farther r is from 0, the stronger is the association. If r=±1, the relationship between the variables is a linear function. Also, the value r2 (coefficient of determination) indicates how much of the variance in one of the variables is explained by the variance in the other (Daya, 2004; Norman & Streiner, 2008, pp. 136-140).
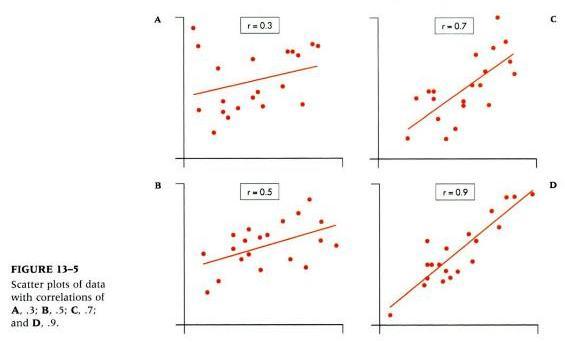
The figure shows some examples of distributions of data points at different correlation coefficients r (Norman & Streiner, 2008, p. 138).
According to Anderson and Bushman (2001), r between the time spent playing video games (variable X) and engaging in aggressive behaviors (variable Y) in 21 experimental tests was 0.18 (p. 357). After stating that, the authors conclude: “short-term exposure to violent video games causes at least a temporary increase in aggression” (Anderson & Bushman, 2001, p. 357).
Thus, it means that Anderson and Bushman (2001) found a positive correlation between X and Y that slightly tended to be linear. However, from Norman and Streiner (2008), it follows that the r-value of 0.18 is not “large enough to take note of” (p. 140), and the correlation is weak. Also, the coefficient of determination r2 = 0.0324 means that only 3.24% of the variance in the Y value is explained by the correlation between the variables X and Y (Daya, 2004, p. 50).
Because of this, and because “correlation does not equal causation” (Norman & Streiner, 2008, p. 139), the conclusion of Anderson and Bushman (2001) that “short-term exposure to violent video games causes at least a temporary increase in aggression” (p. 357) may be incorrect.
“The correlation between X and Y was statistically significant” means that the likelihood that this correlation occurred by chance was low; usually, the phrase “statistical significance” means the likelihood is lower than 5% (George & Mallery, 2016, p. 112).
Unit 6 Discussion 1
A research question from my career specialization (General Psychology) that can be addressed by a correlation is as follows: is there an association between unemployment and life satisfaction? Importantly, the definition of an unemployed person is: an individual who currently has no job, is available for work, and is seeking a job (Reiff, 2015); people who have no job and are not looking for it are of no interest here.
This association between these two phenomena might be measured by a correlation because it is likely that being unemployed for a long period is a factor that significantly decreases one’s level of satisfaction with life. It is probable that the association between the two factors could be close to linear, i.e., if one variable changes, the other also does (Daya, 2004).
The variables that could be measured here are: the length of the period over which a person has been unemployed (X) and that person’s satisfaction with life (Y). It is possible to measure X in weeks. Y can be measured using a 7-point Likert scale (1–completely dissatisfied; 2–dissatisfied; 3–somewhat dissatisfied; 4–unsure; 5–somewhat satisfied; 6–satisfied; 7–completely satisfied).
It is possible to expect that the variables X and Y will be correlated. The correlation coefficient r is likely to be lower than 0, for it is likely that the longer a person is unemployed (the greater is X), the lower their life satisfaction level is (the lesser is Y). Also, r should be greater than -1 (so the relationship between X and Y is not a linear function) due to several reasons; for instance, there are numerous other factors which might affect life satisfaction, such as the socioeconomic status of a person’s family, health, marriage status, etc.
References
Daya, S. (2004). Correlation coefficient. Evidence-Based Obstetrics and Gynecology, 6, 48-50. Web.
Reiff, M. R. (2015). On unemployment: A micro-theory of economic justice (Vol. 1). New York, NY: Palgrave Macmillian.
Anderson, C. A., & Bushman, B. J. (2001). Effects of violent video games on aggressive behavior, aggressive cognition, aggressive affect, physiological arousal, and prosocial behavior: A meta-analytic review of the scientific literature. Psychological Science, 12(5), 353-359.
Daya, S. (2004). Correlation coefficient. Evidence-Based Obstetrics and Gynecology, 6, 48-50. Web.
George, D., & Mallery, P. (2016). IBM SPSS Statistics 23 step by step: A simple guide and reference (14th ed.). New York, NY: Routledge.
Norman, G. R., & Streiner, D. L. (2008). Biostatistics: The bare essentials (3rd ed.). Hamilton, Ontario: B.C. Decker Inc.