Introduction
Wal- Mart Stores Inc., the number one out of Fortune 500 companies, is selected for this financial analysis report. The trend table herein this write-up contains calculations of ratios under all possible areas of financial assessment of a company. Comparisons with Industry have been made with leaders in specific financial areas. The suggestions to deal with weak areas of Wal Mart have been made alongside the assessment of that area. Also, the assessment made in this write-up has been compared with the assessment of the management of Wal- Mart in its Annual return 2008.
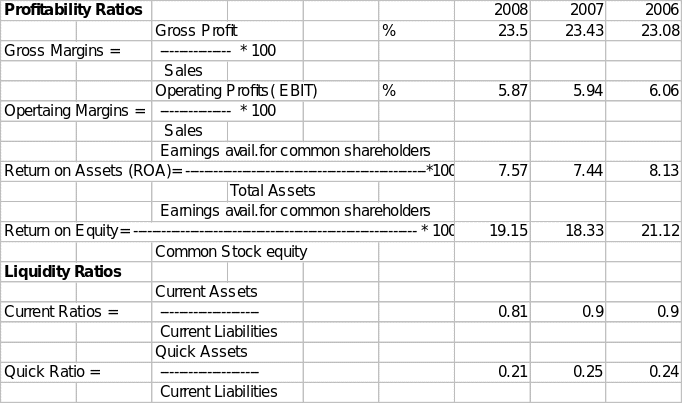
Trend Table
The following table shows the ratio trend touching different aspects of financial analysis.
Three years have been considered to calculate the ratios.

Wall Mart and the Industry
Wal-Mart belongs to the Discount, variety stores industry. Let us start with revenue growth. The Wal Mart revenue has gone up from $344922m in 2007 to $374526m in 2008, giving a rate of growth of 8.6%. In the Industry, the leader is 99Cents Only Stores, and its growth rate in revenue is 27%, though volumes are lower than the Wal- Mart. Wal mart is yielding a fantastic return on equity of 19.15%, after considering minority interest, which is also the Industry’s highest. As far as dividend is concerned, Wal- Mart has declared a dividend of 0.88p per common share, giving a yield of 1.70%, whereas industries best is provided by Family Dollar Stores Inc., and that is 2.5%.
The real test while making a comparison with Industry is the company P/E ratio. “P/E ratio measures the amount that investors are willing to pay for each dollar of a firm’s earnings. The level of this ratio indicates the degree of confidence the investors have in the firm’s future performance. The higher the P/E ratio, the greater the investors’ confidence.” (Lawrence J. Gitman, 2007)1 The P/E ratio of Wal-Mart is 16.07%, whereas in the Industry highest belongs to 99Cents Only Store, and that is fantastic 85.67%.
Industry figures suggest that Wal- Mart growth in EPS is only 8.10% against the best figure of 341.50% of BJ’s Wholesale Club Inc. It may be noted that industry figures show performances of the leader company in one aspect of the overall performance. Wal-Mart is performing extremely well despite the fact in some specific performance, other firms are taking the lead. The volume of revenue and operating profit of Wal Mar are best, and in fact, operational profit has shown a growth of 12.8% over 2007, and that is remarkable. (Please note that the source for industry figures is Yahoo.com)
Financial condition of the company
Financial condition or health is basically assessed from the liquidity position, the capital structure of the company, and its profit margins.
Liquidity
So far as liquidity is concerned, it can be assessed through the current ratio and quick ratio of the company. “Current ratio is a test of the financial strength of the company. It calculates how many dollars in assets are likely to be converted to cash within one year in order to pay debts that come due during the same year.” (Joshua Kennon).
Generally speaking, current ratio of 2:1 is considered optimum in all types of industries. But this criterion differs from Industry to Industry as well. The current ratios of Wal- Mart during the years ending in January 2008, 2007, and 2006 are 0.81, 0.9, and 0.9, respectively. The ratio all along has been less than two and thus very week. The reason for such a low current and delicate liquidity position is basically the nature of the business of Walmart. Most of the sales of Wal- Mart are counter sales, and whatever are the credit sales, those are collected within a period of an average of 3 days. This is clear from the average collection periods for three years calculated in the above trend table. The average collection period for 2008, 2007, and 2006 are 3.5 days, three days, and 3.4 days, respectively.
A small percentage of sales resulting in accounts receivable gets converted into liquidity within a period of 3 days, and such converted liquidity gets utilized elsewhere, leaving current assets at a very low level as compared to current liabilities.
The quick ratio is another barometer of the liquidity of the company. The quick ratio is part of the current ratio. The only difference is that it considers in its calculations only those assets that get converted into liquidity earlier than others. That is why inventory is not considered in its calculations. The current ratio of 1:1 is considered optimum. Wal- Mart has a quick ratio during 2008, 2007, and 2006 of 0.21, 0.25, and 0.24, respectively. This reflects a very delicate liquidity position, and unless it is improved, the company may face problems in meeting short-term obligations.
Wal- mart must take concrete steps to improve its liquidity position. The better way is to raise debts funds for a longer period and temporarily utilize those for the current period till the liquidity of the company gets improved.
Capital structure
The other aspect of judging the financial position of the company is to view the capital structure of the company. In other words, it is required to be seen how the company has financed its assets. To assess this debt ratio calculated in the above-trend table provides necessary and relevant information. “The lower the debt ratio, the less total debt the business has in comparison to its asset base. On the other hand, businesses with high total debt ratios are in danger of becoming insolvent and/ or going bankrupt.” (Susan Ward). The debt ratio of the company for 2007, 2006, and 2005 as calculated in the trend table is 0.59, 0.58, and 0.6 respectively. The ratios in all three years are low. This shows that the company has a healthy capital structure. Most of the assets have been financed through capital equity, about which the company need not worry about repayments. However, the capital is low geared, and the company’s equity holders may not be able to take advantage of the gearing of the capital structure.
Profitability
Gross margins and operating margins reflect the earning capacity of the company. “Gross margin measures the percentage of each sales dollar remaining after the firm has paid for its goods. The higher the gross profit margin, the better (that is, the lower relative cost of merchandise sold).” (Lawrence J. Gitman). The gross margins of Wal- Mart for 2008, 2007, and 2006 are 23.5%, 23.43%, and 23.08%, respectively. The gross margin is rising with a rise in the turnover year by year. This is a good sign of growth as well as shows the efficiency in meeting the cost of sales.
Operating margins are gross margins remaining after meeting the overheads and other administrative costs but before interest and taxes. “It represents the ‘pure profits’ earned on each sales dollar. Operating profits are ‘pure’ because they measure only the profits earned on operations and ignore interest, taxes, and preferred stock dividends.” (Lawrence J. Gitman). Operating profit of the Wal- mart is reducing since 2006. From 6.6% in 2006, it has come down to 5.94% in 2007 and 5.87% in 2008. The reason is uncontrolled overheads. Wal- mart should make efforts to show efficiency in controlling the overheads and administrative costs to give a rising trend to operating profits; otherwise, efficient results of gross margins will not reach equity investors.
Limitation of basing the assessment of financial health
Other factors, besides those considered in the proceeding portion of this write up, for assessing a company’s health are as under:
- Price Earning (P/E) ratio: Though this is not a direct calculation of the financial health of the company, it indicates a lot about the financial health of the company. “If there is one number that people look at more than any other number, it is the ‘Price to earning ratio.’ The P/E is the ratio that investors throw around with confidence as if it told the complete story. Of course, it does not tell the whole story (if it did, we wouldn’t need all the other numbers.) (Kanoj Badami). The P/E ratio of Wal- Mart for 2006, 2007, and 2008 is 16.49, 17.11, and 16.07, respectively. The ratio is averaged around 16.5 %, and what a confidence investors are showing in Wal- Mart. That indirectly means that financial health is considered stable for the years to come, and that is why investors are ready to put in their funds.
- Return on assets: This ratio determines the return on investments on assets and, thus, in a way, measures the health of the entity with regard to the exploitation of assets. Wal- mart has a rising ratio of 2.29, 2.28, and 2.24 in 2008, 2007, and 2006. The company is earning increasingly well when profitability is related to the exploitation of assets.
- Time Interest Earned ratio: This ratio tells how healthy the company is in meeting its financial cost of borrowed capital, i.e., interest. Wal-Mart is very healthy from this point of view as in 2008 it has profits 12.23 times more than its interest expense. Though the ratio has come down from 15.89times in 2006 and 13.41 times in 2007, yet at 12.23time in 2008 is considered to be a very healthy status in meeting interest expense liabilities.
Accordingly, by assessing the financial health of the company through these three factors, the limitations of the factors of liquidity, capital structure, and profitability in assessing the financial health of the company get discounted, and a real overall picture come forward to view the financial health at alternative angles.
Comparison of assessment with the Annual Return 2008
On comparing the above assessment about the financial condition and financial health of Wal- Mart with its Annual Report 2008, the following observations can be made:
- The Management’s Discussion and Analysis section of Annual Report 2008 states that “In fiscal 2008 gross margin increased slightly compared to prior years primarily because of higher initial margins and decreased markdown activity as a result of improved inventory management.” 7. Similarly, in our assessment above, it has been stated that gross margin is rising year by year because of efficiency in cost of sales. That means there is a similarity in both assessments.
- The Annual return 2008 states that “Management believes that ‘Return on investments’ is a meaningful matrix to share with investors because it helps investors assess show Wal efficiently- mart is employing its assets” 8 Return on investments is in fact return on sets. We have also taken the same view while suggesting alternative matrices that ROA is a ratio that tells the effective exploitation of assets.
- The Annual Return 2008 has considered current ratios, return on assets, and return on equity to assess the financial position. We have also considered the financial health of Wal- mart on similar grounds.
Problems and measures to mitigate those problems
The major problem that Wal- Mart is facing is that of its liquidity, which is further deteriorating with increasing activities over the years. Its current ratio and quick ratios are decreasing year by year. The basic reason is attributable to fewer credit sales. The liquidity generated on counter sales gets utilized for purposes other than meeting short-term obligations.
As the company’s debt ratio is very low, it is suggested that the company may raise funds on the basis of long-term borrowings. Some portion of such borrowings may be temporarily utilized for meeting short term obligation till the current ratio positions get improved.
Assessment of management initiative detailed in annual report
The management has reiterated in annual return 2008 its three angled approach to provide relief to customers from price rise effects of inflation:
- Offer price leadership on top quality brands. That is to say Wal Mart after taking advantage of bulk purchasing, should pass on the benefit to its customers.
- Ensure clarity of friend offerings. That is to say, behavior with customers must support or reflect the fact that benefits of trading are all for the customers only.
- Invest in growth categories. This implies that investments in inventories should provide extra cushion of earning over the period.
The management initiative on policy matters will attract customers, and with increased turnover, the company will be able to solve many problems of financial health like liquidity and profitability.
Possible problems that company may face in the near future are as under:
- Liquidity crunch, as low current ratio unless improved may prove fatal to financial position at near future.
- Low geared capital does not allow common shareholders to take advantage of low geared capital investment. This requires an immediate floating of debt issues.
Conclusion
The Wal- Mart Inc. is a leader in the Industry in many respects, but it has ills that need instant solutions. Like the liquidity position of Wal Mart need great attention.. It is recommended to improve its liquidity by raising loaned funds. Further, in order to keep the company strong in meeting both short and long term obligations, the company should control its overheads that take away the advantage created by an increase in gross margins.
Reference
Lawrence J. Gitman, Principles of Managerial Finance, Eleventh Edition, Part1, Page 69-70.
Yahoo.com, 2008. Web.
Joshua Kennon, Analyzing a Balance Sheet, Current Ratio, About.com: Investing for beginners. Web.
Susan Ward, Is your business sick?, Debt ratio, About.com: Small Business: Canada. Web.
Lawrence J. Gitman, Principles of Managerial Finance, Eleventh Edition, Part1, Page 67
Kanoj Badami, Price to earning ratio and what it means, 2008. Web.
Wal-Marts Annual Report 2008.