Introduction
It is important to note that statistical tests allow an analyzer to see if there are major differences between sets of data. The given report will focus on applying a two-sample t-test for means as well as a chi-squared test by using the Walmart data (Appendix). The former revealed that Walmart’s quality and its variety are statistically different, whereas the latter showcased that there is no relationship between Walmart’s quality and the store’s returns policy.
Two-Sample t-Test for Means
The selected sets are variety and quality, and the null hypothesis (H0) is that the means of “Walmart Quality” and “Walmart Variety” are equal. The alternative hypothesis (H1) is that the means for these metrics are not the same. For the given analysis, the test statistic or t-value is -2.53, and the p-value = 0.0136, with a confidence interval (CI) of 95%. The overall conclusion is that H0 is rejected since the CI threshold (0.05) is bigger than the p-value; therefore, there is an inequality between the averages of the given sets of numbers.
Chi-Squared Test
The chi-squared test is good for working with categorical values, which is why the provided data needs to be adjusted. Framing the numbers as contingency groups is highly useful; hence, “Walmart Quality” and “Walmart Returns Policy” are placed into these categories – high (5-6), medium (3-4), and low (1-2). In a sense, the test was conducted to see if there was an association between them. H0 is that there is no association between “Walmart Quality” and “Walmart Returns Policy,” whereas H1 is that there is a link. The value for the chi-squared statistic is 3.88, which is why the p-value is 0.4226 (CI = 95%).
The result is that the p-value is larger than the standard alpha level (0.05, 95% CI); thus, it does not reject H0. The latter means that there is no major association between “Walmart Quality” and “Walmart Returns Policy” (Peck et al., 2019). In other words, how customers rate Walmart’s quality is not significantly related to how they rate the store’s returns policy.
Situation/Problem
In my everyday life, I have two big problems: I procrastinate excessively often, and I sleep insufficient hours, which is usually six. I think that the chi-squared test would be of great use here to properly measure these two factors that I believe are related to each other. My hypothesis is that if I sleep more, such as eight hours, I have a lower inclination to postpone doing most important tasks. For the business problem, it involves a company assessing customer satisfaction and its service. Stakeholders include top management, marketing teams, and customer service departments. Key variables are quality, variety, returns policy, personnel service, and prices.
Conclusion
In sum, a two-sample t-test for means showed that Walmart’s variety and its quality are different on a statistical level, and the company’s returns policy is not significantly related to the overall quality. Both statistical tests are highly useful tools to measure distinctions and relationships between two datasets. However, it is critical to understand that the first test assessed whether the datasets are equal, whereas the second analyzed if they are associated with each other.
Reference
Peck, R., Olsen, C., & Short, T. (2019). Introduction to statistics and data analysis (6th ed.). Cengage Learning.
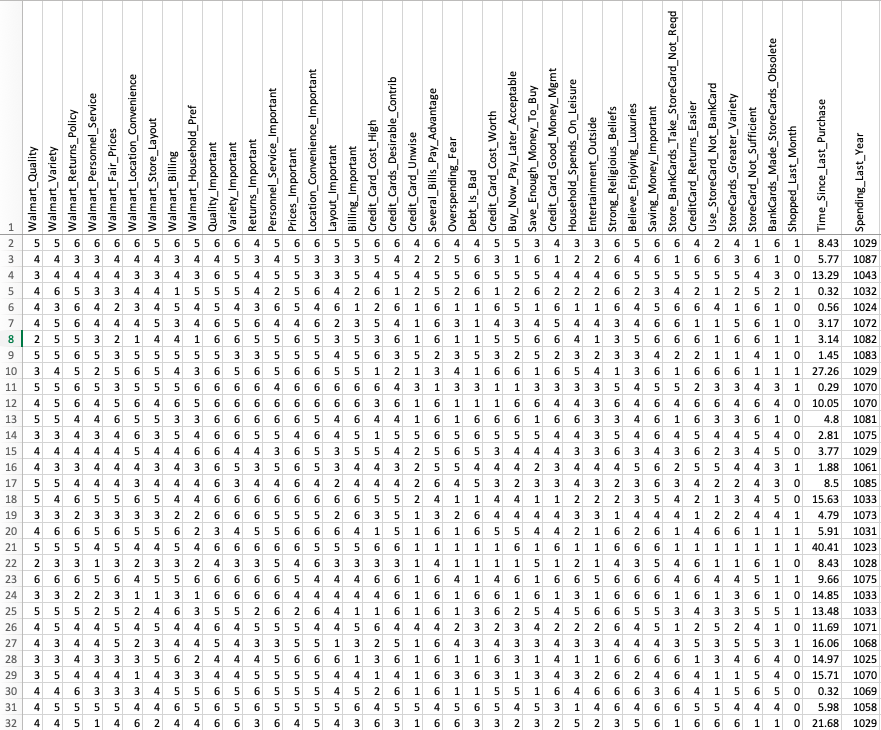
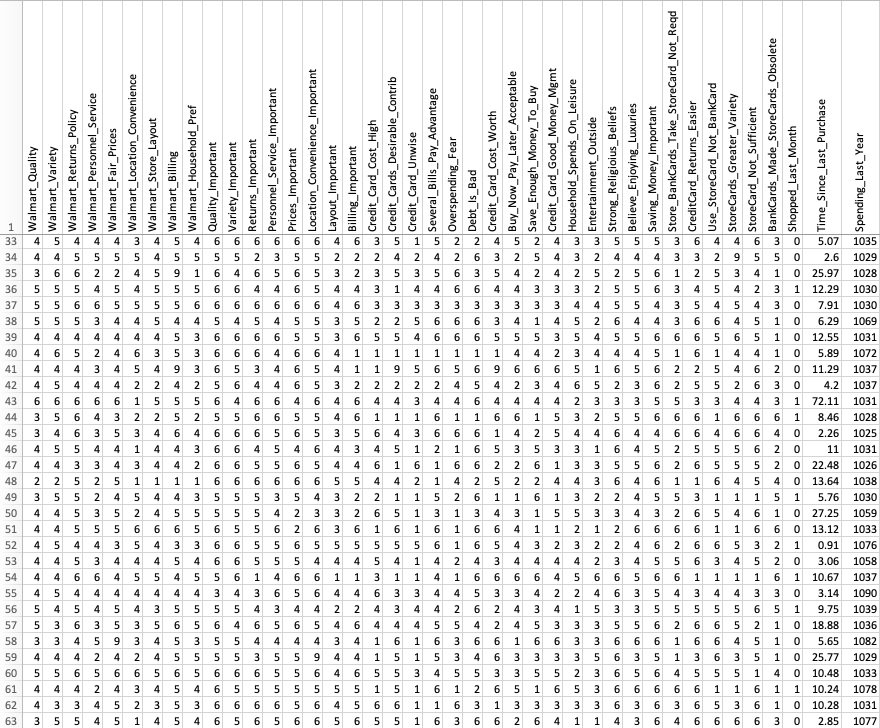
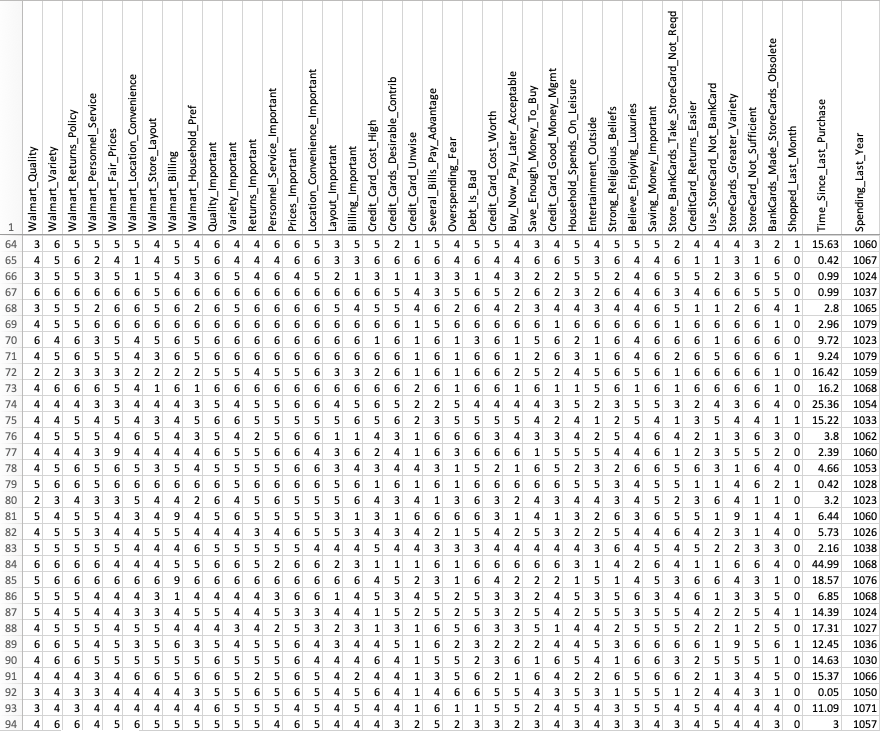
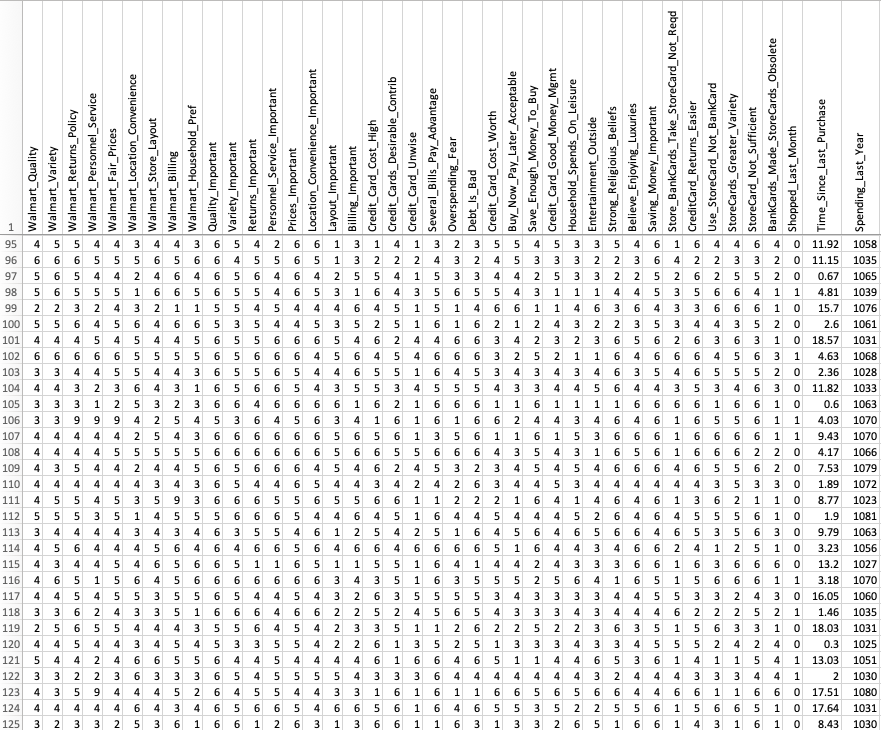
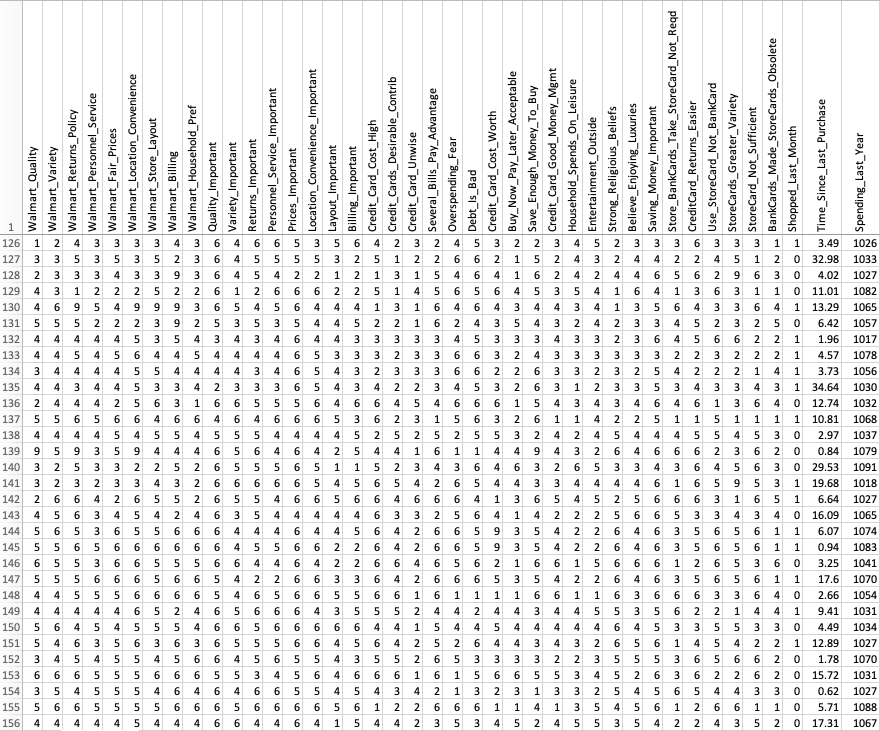
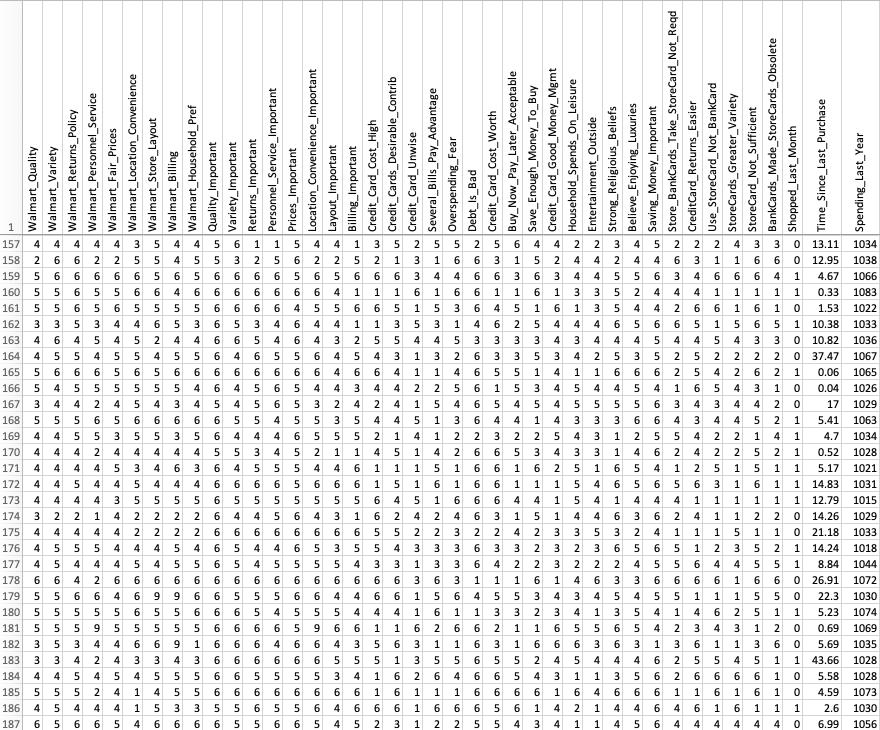
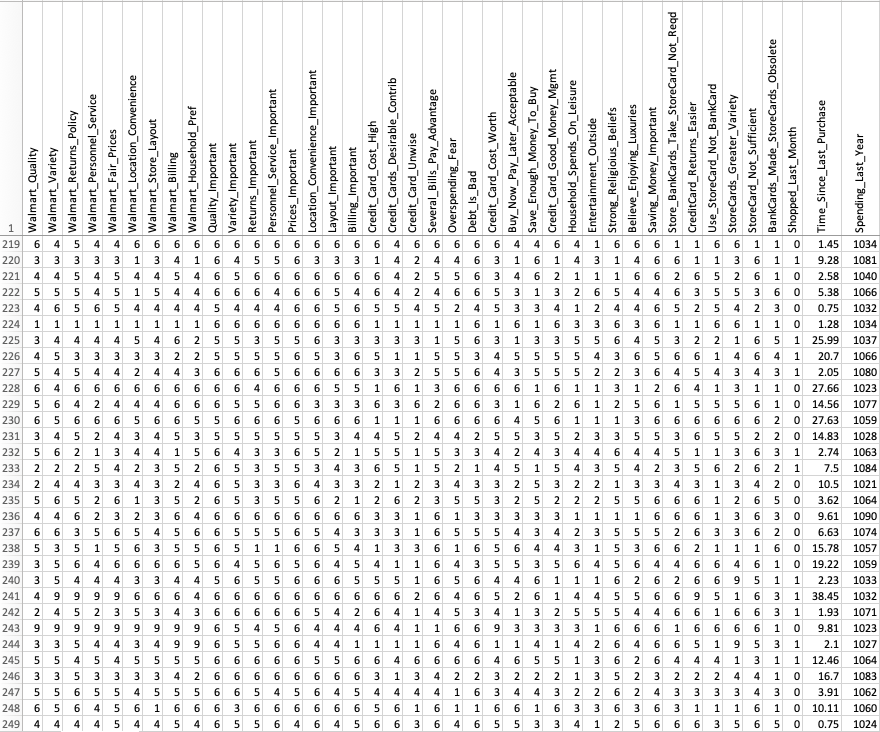
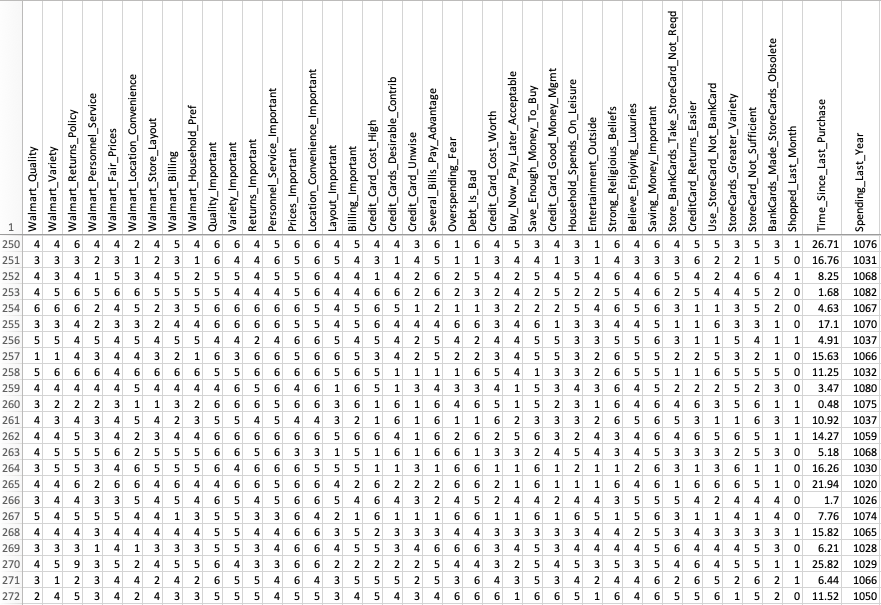
Appendix
Table 1 – Walmart Data