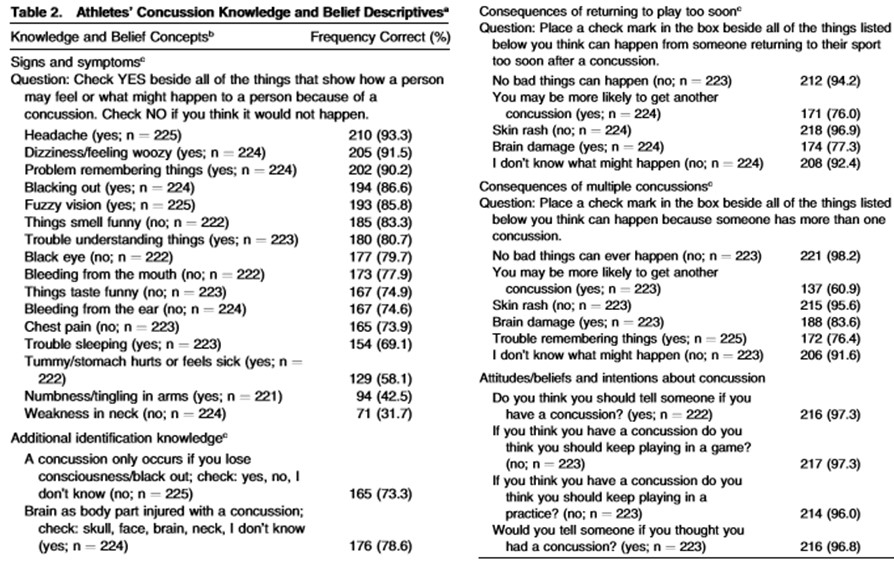
Young athletes’ concussion knowledge and belief descriptives table:

For my first search, I used the word “concussion.” On the Advanced Search page, I limited the search to peer-reviewed articles in English published in the last three years, for which full text is available. I chose this article because I found the topic interesting and wanted to read other materials on the matter. 3,286 results were found for my search query, all of them being articles in scholarly journals. For my paper, I am using this article: Register-Mihalik, J., Williams, R., Marshall, S., Linnan, L., Mihalik, J., Guskiewicz, K., & Valovich McLoed, T. (2018). Demographic, parental, and personal factors and youth athletes’ concussion-related knowledge and beliefs. Journal of Athletic Training, 53(8), 768–775.
The frequency distribution table provides the descriptives of young athletes’ concussion knowledge. Athletes’ awareness of the symptoms and consequences of concussion was examined using 29 questions, and their beliefs and attitudes on the matter were evaluated using five questions on concussion recognition and response. The table shows the number and percentage of correct answers in the group of 225 people, with the classes being of consistent size.
Based on the survey results, it can be concluded that young athletes’ concussion knowledge is extensive, with the percentage of correct answers ranging from 31.7% to 98.2%. Concussion attitudes and beliefs can be described as positive, with 216 out of 222 (96.8%) of respondents stating that they would seek help if they thought that they had of concussion (Register-Mihalik et al., 2018). The study shows that nearly 80% of young athletes have an awareness of the majority of concussion symptoms, with headache being the most recognized symptom (93.3% of correct answers). The least known signs of a concussion included neck weakness (31.7% correct) and numbness (42.5% correct).
The data is displayed in the form of a table with questions listed in the first column and the number and percentage of correct answers listed in the second. These data might have been displayed in the form of a bar chart, with each bar showing the number of correct answers to a particular question, or in the form of a graph. I think that a bar chart would provide a more illustrative representation of athletes’ level of awareness. However, it would be hard to design, considering that the questions are lengthy, and the percentage of correct answers does not differ greatly. The graph would be a less applicable form of presentation, being more illustrative on the one hand, but harder to design on the other.