Statistical Tools and Methods
Working on the development of sales forecast for a company is essential for the further identification of the strategies, which the organization in question views as crucial for attracting new customers and increasing its profitability rates (Roberts & Russo, 2014). In order to address the situation described in the case study and create a viable forecast for the A-Cat Corporation, one will have to consider the ANOVA testing as the key statistical tool
The reasons for choosing the specified statistical tool are quite obvious. As a previous analysis of the company’s performance has shown, the lack of consistency in the cooperation among the staff members as well as the leadership strategy that leaves much to be desired make the environment of the organization quite impossible for the staff to work productively in. Herein the key risks lie; to perform a detailed evaluation of the company’s operations, including the factors that served as a boost for a change, an all-embracive analysis of economic, financial, legal, political, technological, social, and cultural factors will be required (Calberg, 2014). The ANOVA test will help embrace two key statistical data and, thus, perform a twofold analysis that will prove the null hypothesis either right or wrong, therefore, pointing to the direction that the organization will have to follow (Wang, 2012). Thus, to assess the alterations in the performance of the employees, which is bound to occur after the corresponding changes in the leadership strategy and the overall design of the roles and responsibilities distribution is incorporated into the firm’s design, one will have to consider the ANOVA testing (MacFarland, 2011).
Data Analysis
As the calculations provided in Table 1 show, the organization is likely to face a rather steady increase in its revenues due to the change in the production process and the redesign of its current approach towards forecasting of the amounts of items produced.
Table 1. ANOVA Test
Nevertheless, the analysis results show that the current approach still needs polishing. Particularly, the fact that the variation rates within the groups identified can be deemed as high deserves to be brought up as a possible impediment to the organization’s further success. Unless a strategy for making the firm’s progress more even and the sales rates more steady is introduced, the firm may face certain financial challenges. It should be noted, though, that the overall prognosis for the firm’s further development is quite positive. Although the evolution of the entrepreneurship can be described as rather slow, the outcomes of the test clearly point to the further success of the organization.
Indeed, the fact that the F-value is above the stated amount shows that the null hypothesis regarding the correlation between the number of refrigerators and the requirements concerning the transformers can be disregarded. In other words, it is assumed that the firm will be able to deliver the number of transformers necessary for the further design of the refrigerators of the required quality. Indeed, a closer look at the test results will reveal that the F value (≈57.99) is higher than the F critical (≈4.1); moreover, the difference between the two values is huge. Thus, it can be assumed that the null hypothesis regarding the mean number of transformers having changed over the past few decades can be deemed as false. Although there admittedly have been certain fluctuations in the mean number of transformers, as the data sets provided have shown, the correlation between the two types of data as well as the basic characteristics thereof has remained the same. In other words, the slight changes in the average number of transformer requirements cannot be deemed as significant and, therefore, are not to be taken into consideration when charting another forecast for the company’s operations.
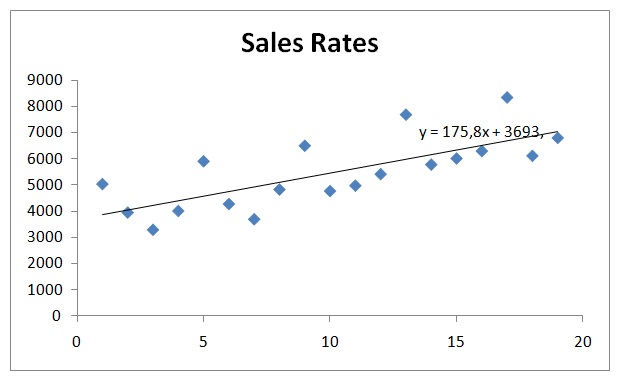
As the chart above shows, the sales forecast is quite favorable for the organization. It should be noted, though, that certain negative tendencies in the generally positive course of the company’s evolution point to the need to reinforce the motivation strategy so that the staff members could deliver better performance results.
Reference List
Calberg, C. (2014). Statistical analysis: Microsoft Excel 2013. New York City, New York: Que Publishing.
MacFarland, T. (2011). Two-way analysis of variance: Statistical tests and graphics using R. Berlin: Springer Science & Business Media.
Roberts. M., & Russo, R. (2014). A student’s guide to analysis of variance. New York City, New York: Routledge.
Wang, L. (2012). Application of LADAR in the analysis of aggregate characteristics. Washington, DC: Transportation Research Board.