Overview of the Redesign Project
Probing the difficult field of aeronautical engineering, our initiative aims to revitalize aviation by redesigning an aircraft that bears a resemblance to the Tu-104. With revised settings, this refreshed model puts itself at a competitive edge over its current rivals. The primary components of our study are the analysis of the distribution of loads on the fuselage and wings.
It is critical to examine the complexities included in the Appendix A – Fuselage Plots and Appendix B – Wing Plots to decipher the stress dynamics that are critical for both structural integrity and aerodynamic efficiency. Supporting this investigation provides a lighthouse, providing an in-depth comprehension of load considerations. With the help of this research, we may embark on a groundbreaking exploration of the intricacies of fuselage and wing load distributions, which will advance aircraft design to a level of aeronautical success never before possible.
Context and Purpose
The dynamic arena of aeronautical engineering, where the quest for innovation continuously advances the aviation industry, serves as the backdrop for this paper. The goal is to meticulously investigate and rework a plane, taking cues from the Tu-104 but adding modern specifications to make it competitive in the modern aviation industry. This project stands for dedication to pushing the limits of aeronautical excellence in addition to being a technical initiative. The primary objective is to improve the aircraft’s solidity and aerodynamic efficiency as we analyze the subtleties of fuselage and wing load distributions. Our central goal is to make a substantial contribution to the advancement of contemporary aircraft design and performance through this thorough investigation.
Fuselage Load Distribution
The Fuselage Load Distribution, which is attained from Appendix A – Fuselage Plots, is subjected to a comprehensive statistical examination in order to provide a numerical understanding of the complex interactions between forces along the fuselage of the airplane. We can learn a great deal about the central tendencies, variance, and spread of the essential variables by utilizing statistics like mean, standard deviation, and range.
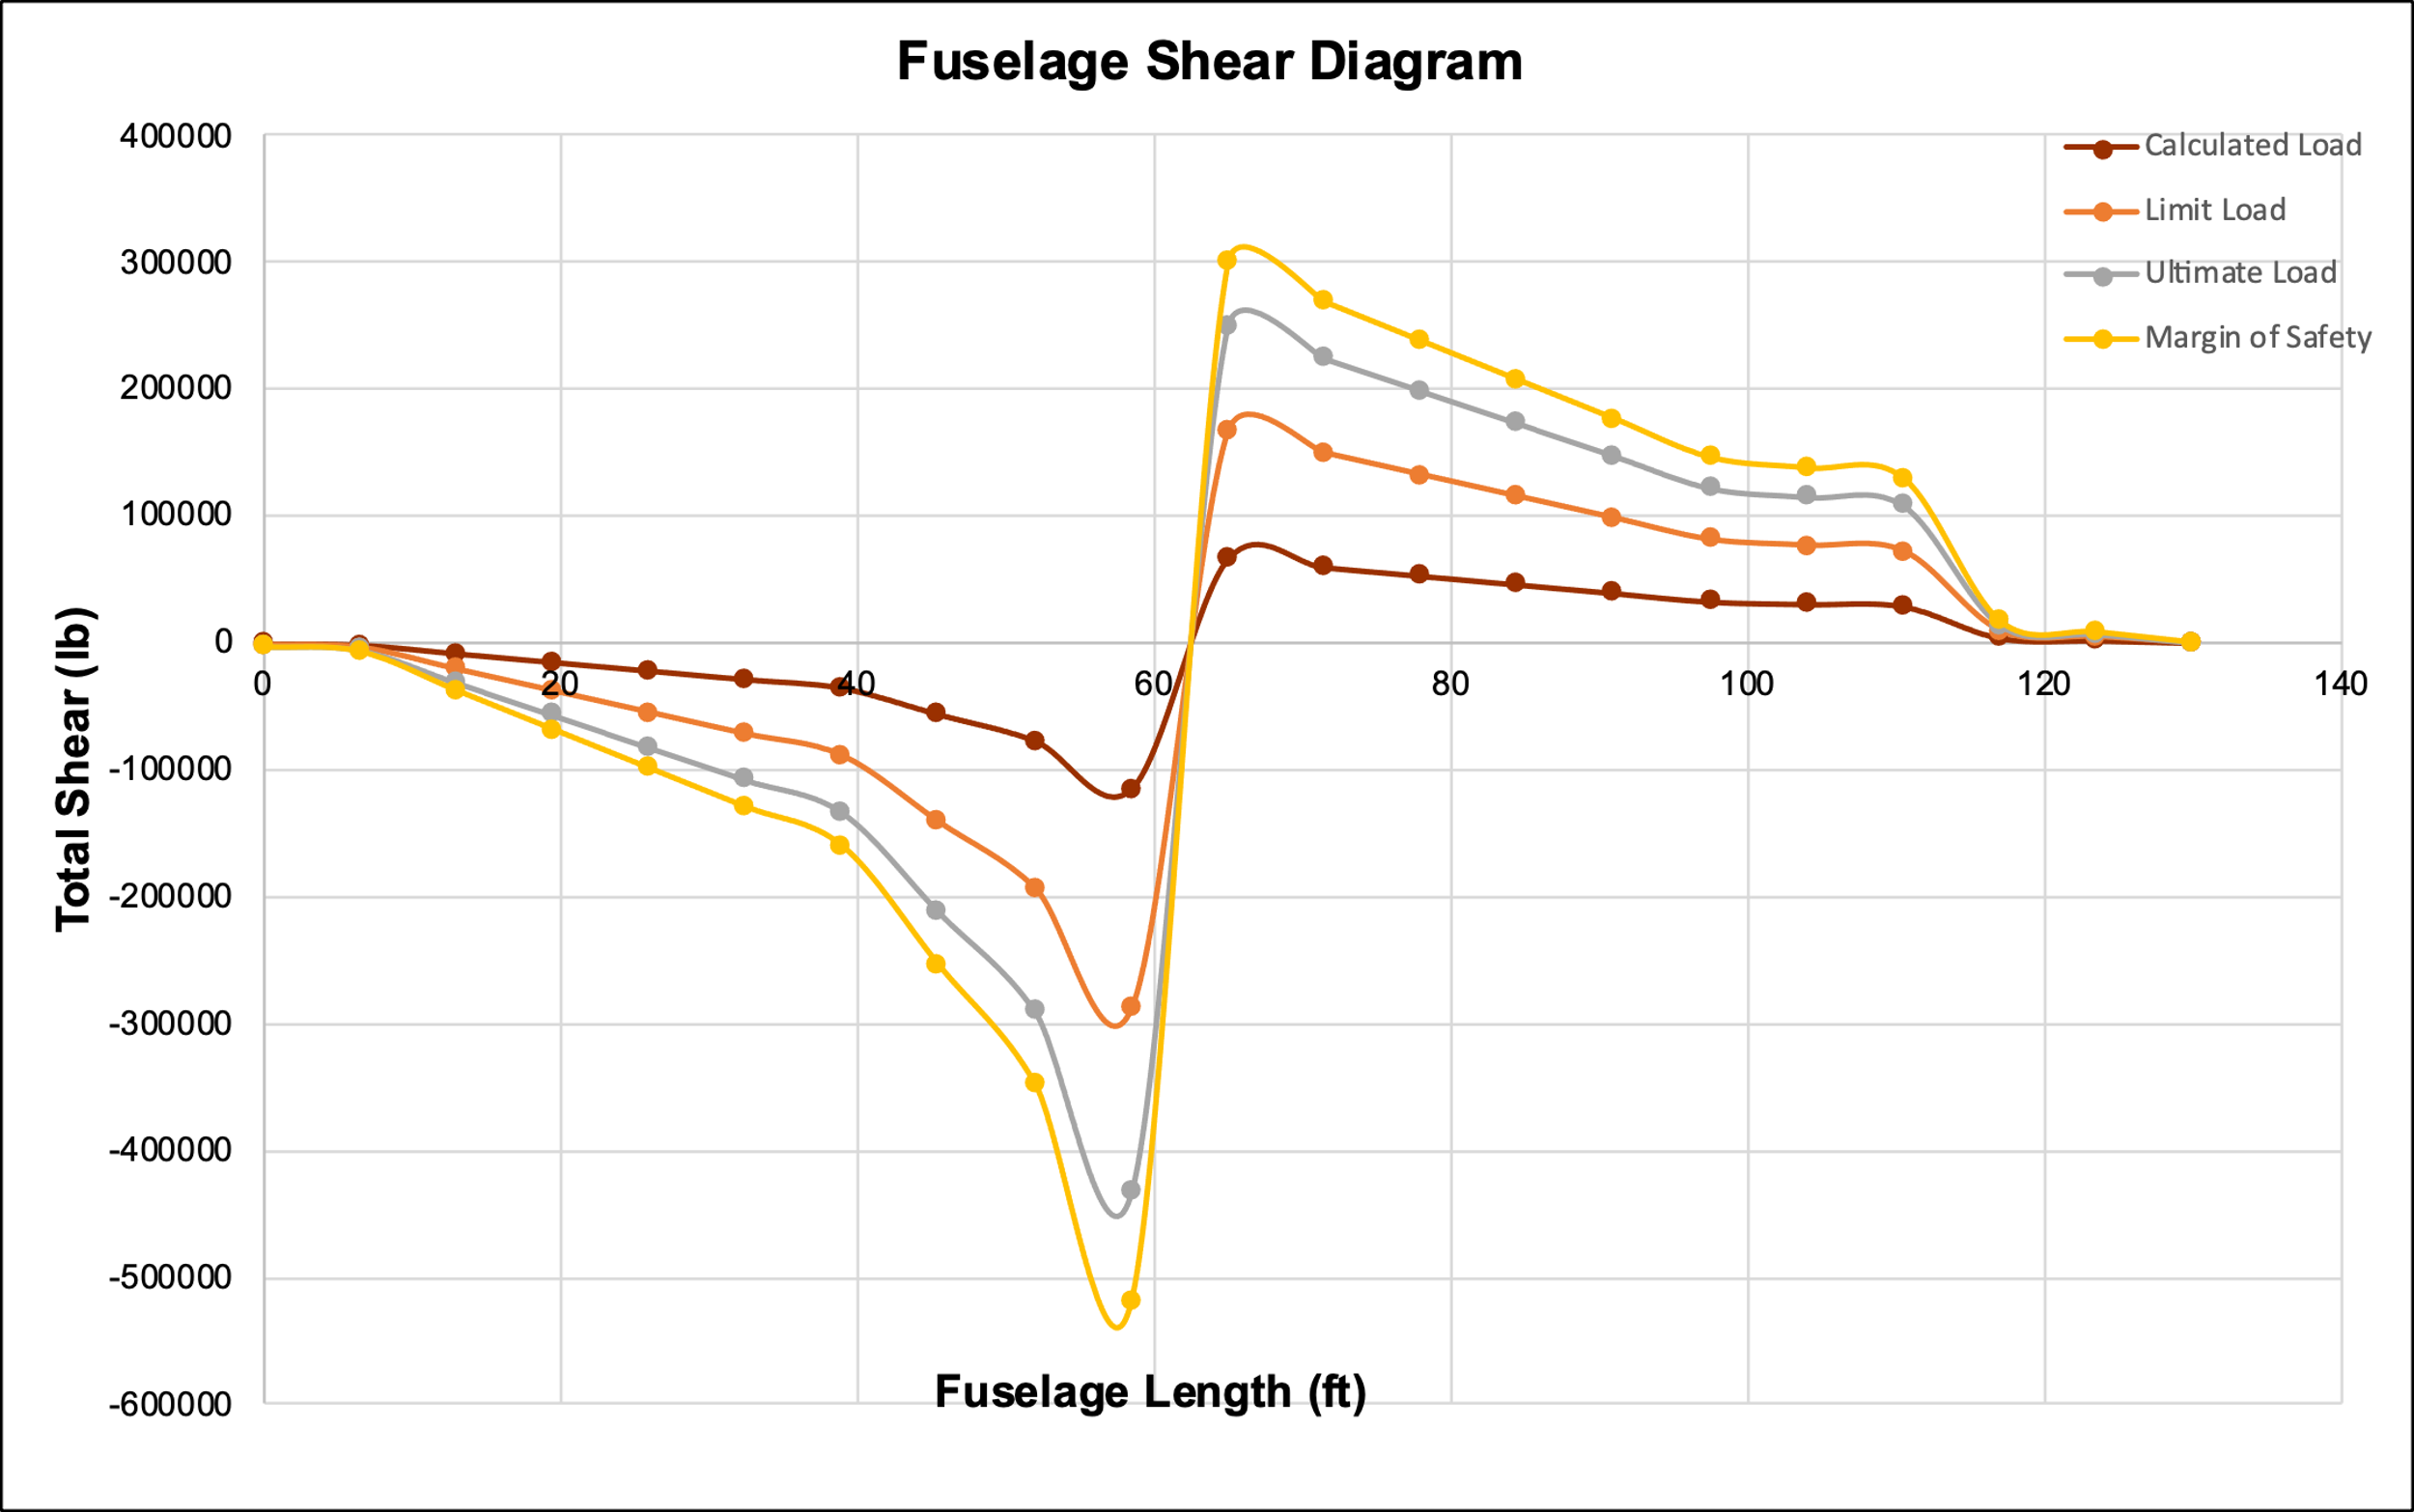
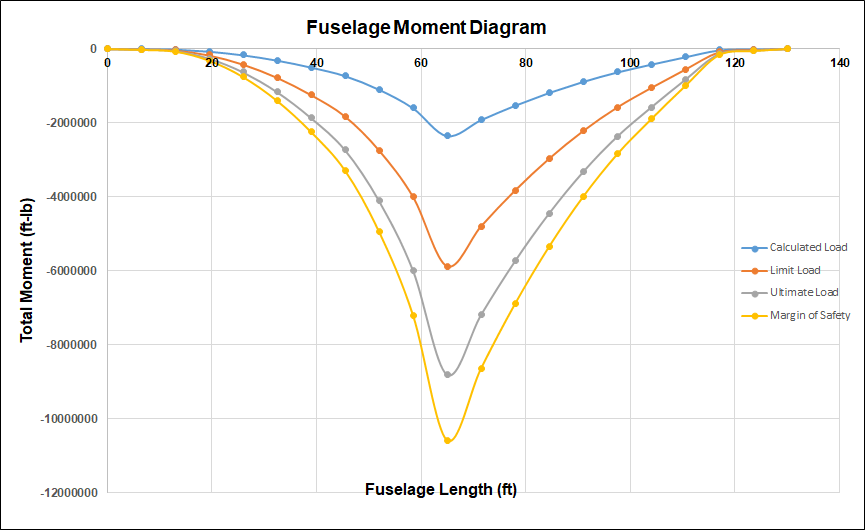
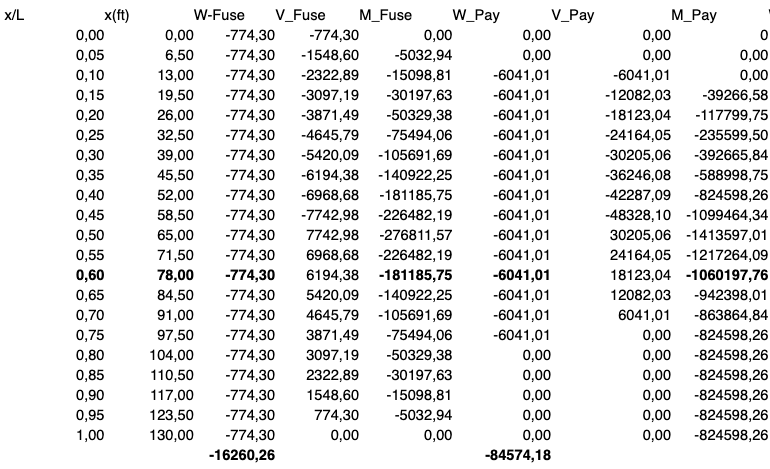
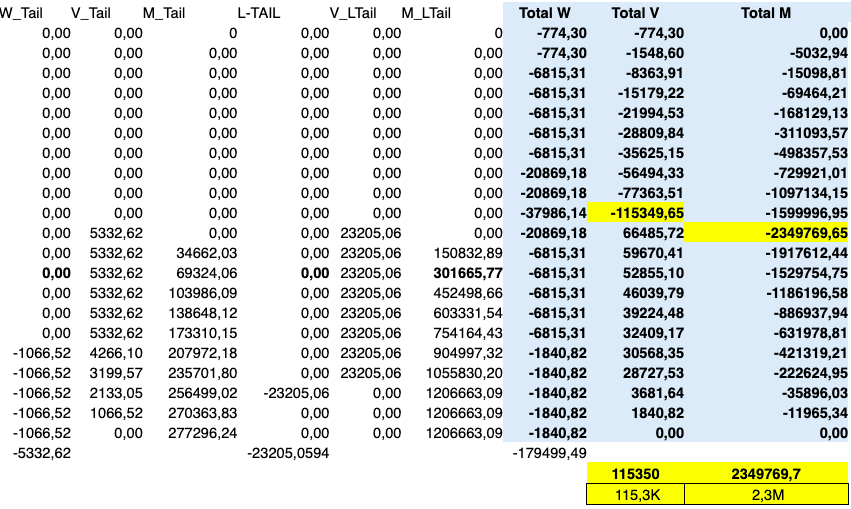
An analysis of the Total Weight statistical breakdown shows that the average weight supported by the fuselage is roughly -6.796 x 10^5. The weight distribution’s degree of variability is shown by the standard deviation, which is approximately 2.872 x 10^5, which also serves as a gauge for possible stress variations among different data points. This statistical lens enhances the understanding of how the fuselage supports the load in various scenarios. Figure 1, the Fuselage Shear Diagram, indicates shear forces along the fuselage, revealing dynamic variations in shear force magnitudes at various load sites to provide a quantitative comprehension of the fuselage’s reaction to external forces.
F fuselage(y)= ∑ Individual Load Contributions
Fuselage Structural Load
F Struct(y)= F Struct (y) / L Fuselage *y (Kim et al. 2829)
Substituting the values = 16260.26 / L Fuselage
Payload Load
F Payload(y)= Y Payload / L Fuselage *y = 84574.18 / L Fuselage
Fuel Load
F fuel= F fuel / L Fuselage (Egan 83)
F Struct(y)= 42000 / L Fuselage * y
Engine Load
F engine y= W fuel / L Fuselage = 17166.96 / L Fuselage
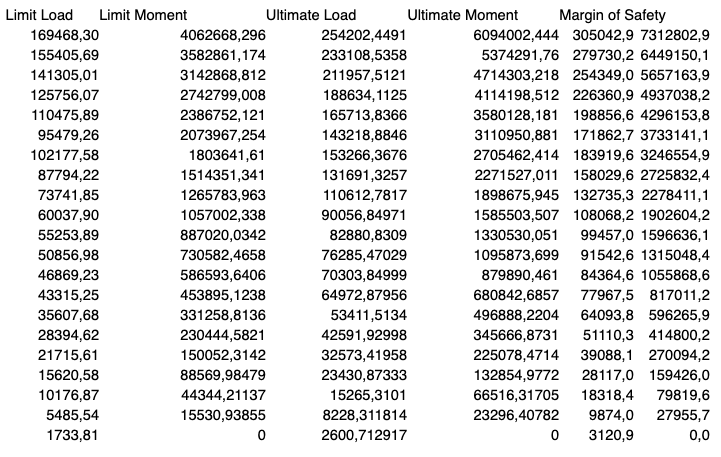
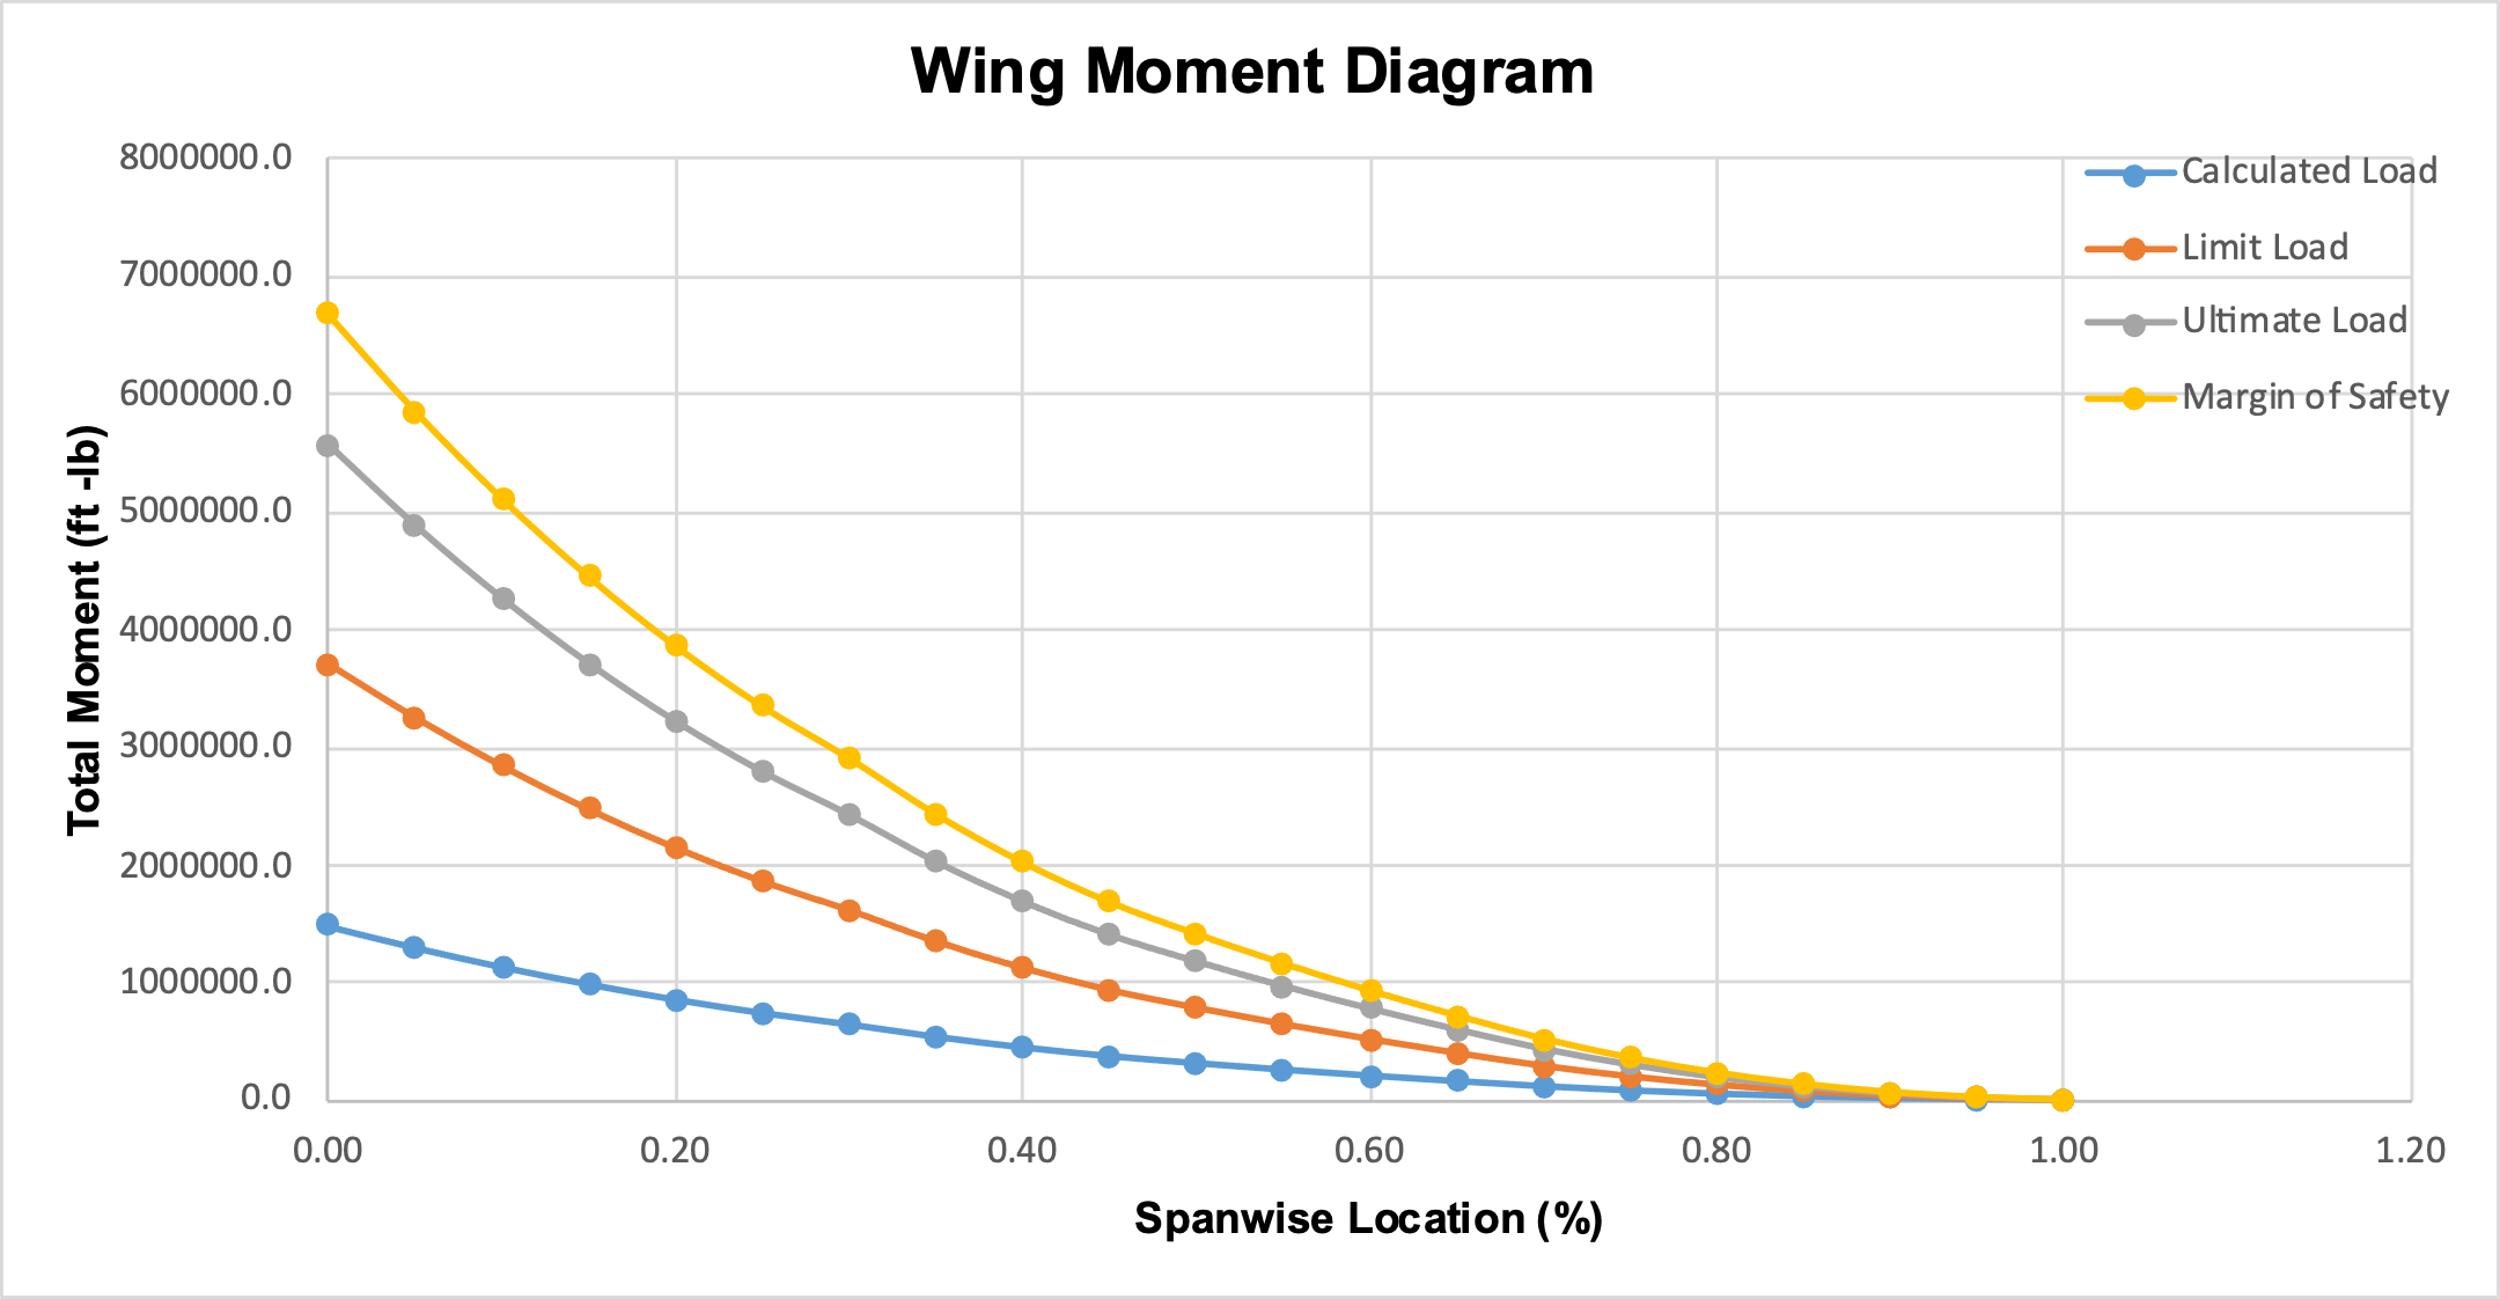
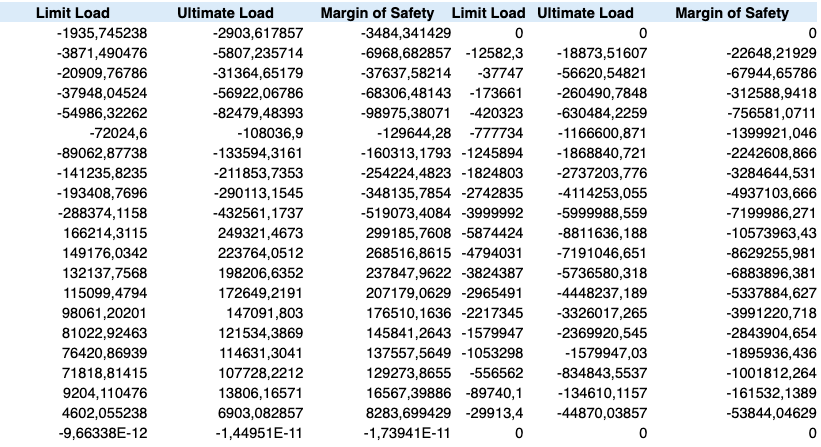
By focusing on the fundamental parameters of the Margin of Safety, Ultimate Load, and Limit Load, statistical assessment adds precision to this analysis. While the Ultimate Load, which averages 2.3498 x 10⁶, depicts the ultimate load-bearing capacity, the mean Limit Load, at about 1.1535 x 10⁵, serves as a reference for the structural limits. The safety margins incorporated in the design are quantified by the Margin of Safety, which has an average of -1.1979 x 10⁵.
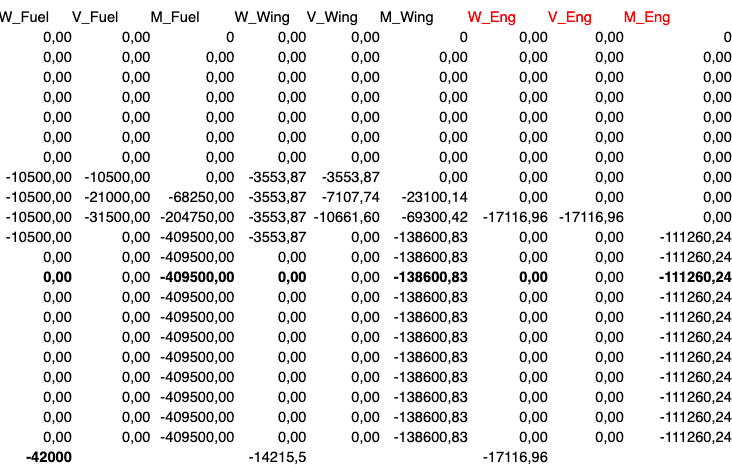
A robust and nuanced comprehension of fuselage load distribution is ensured by this statistical analysis, which lays the groundwork for wise design choices regarding the aircraft’s structural layout. The statistical exploration in Figure 2: Fuselage Load Diagram probes the distribution of axial loads, showing exact facts about load magnitudes at different positions. This statistical methodology advances the evaluation of axial forces, providing vital insights into the load-bearing attributes of the fuselage.
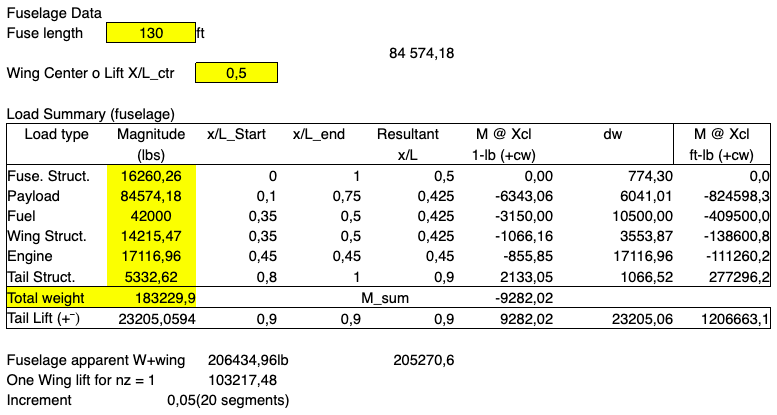
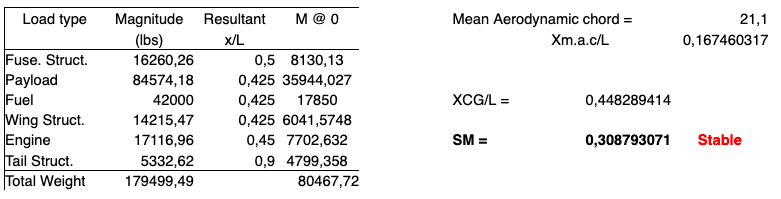
An extensive analysis of the Static Margin, a crucial metric for aero-plane stability, is conducted based on the various loads and their corresponding magnitudes. With a magnitude of 16260.26 lbs., the Fuselage Structure load is positioned at 0.5 x/L, producing an 8130.13 lbs. resultant moment. With the payload weighing 84574.18 lbs. and the position of 0.425 x/L, the moment produced is 35944.0265 lbs. Fuel generates a moment of 17850 lbs. when it is loaded to 42000 lbs. at 0.425 x/L.
The stresses on the engine (17116.96 lbs.) and wing structure (14215.47 lbs.), which are put at 0.425 x/L and 0.45 x/L, respectively, contribute to the consequent moments of 7702.632 lbs. and 6041.57475 lbs. With a weight of 5332.62 pounds, the Tail Structure is positioned at 0.9 x/L, offering it a moment of 4799.358 pounds. A cumulative resultant moment of 80467.72 lbs. is generated by the total weight of 179499.49 lbs.
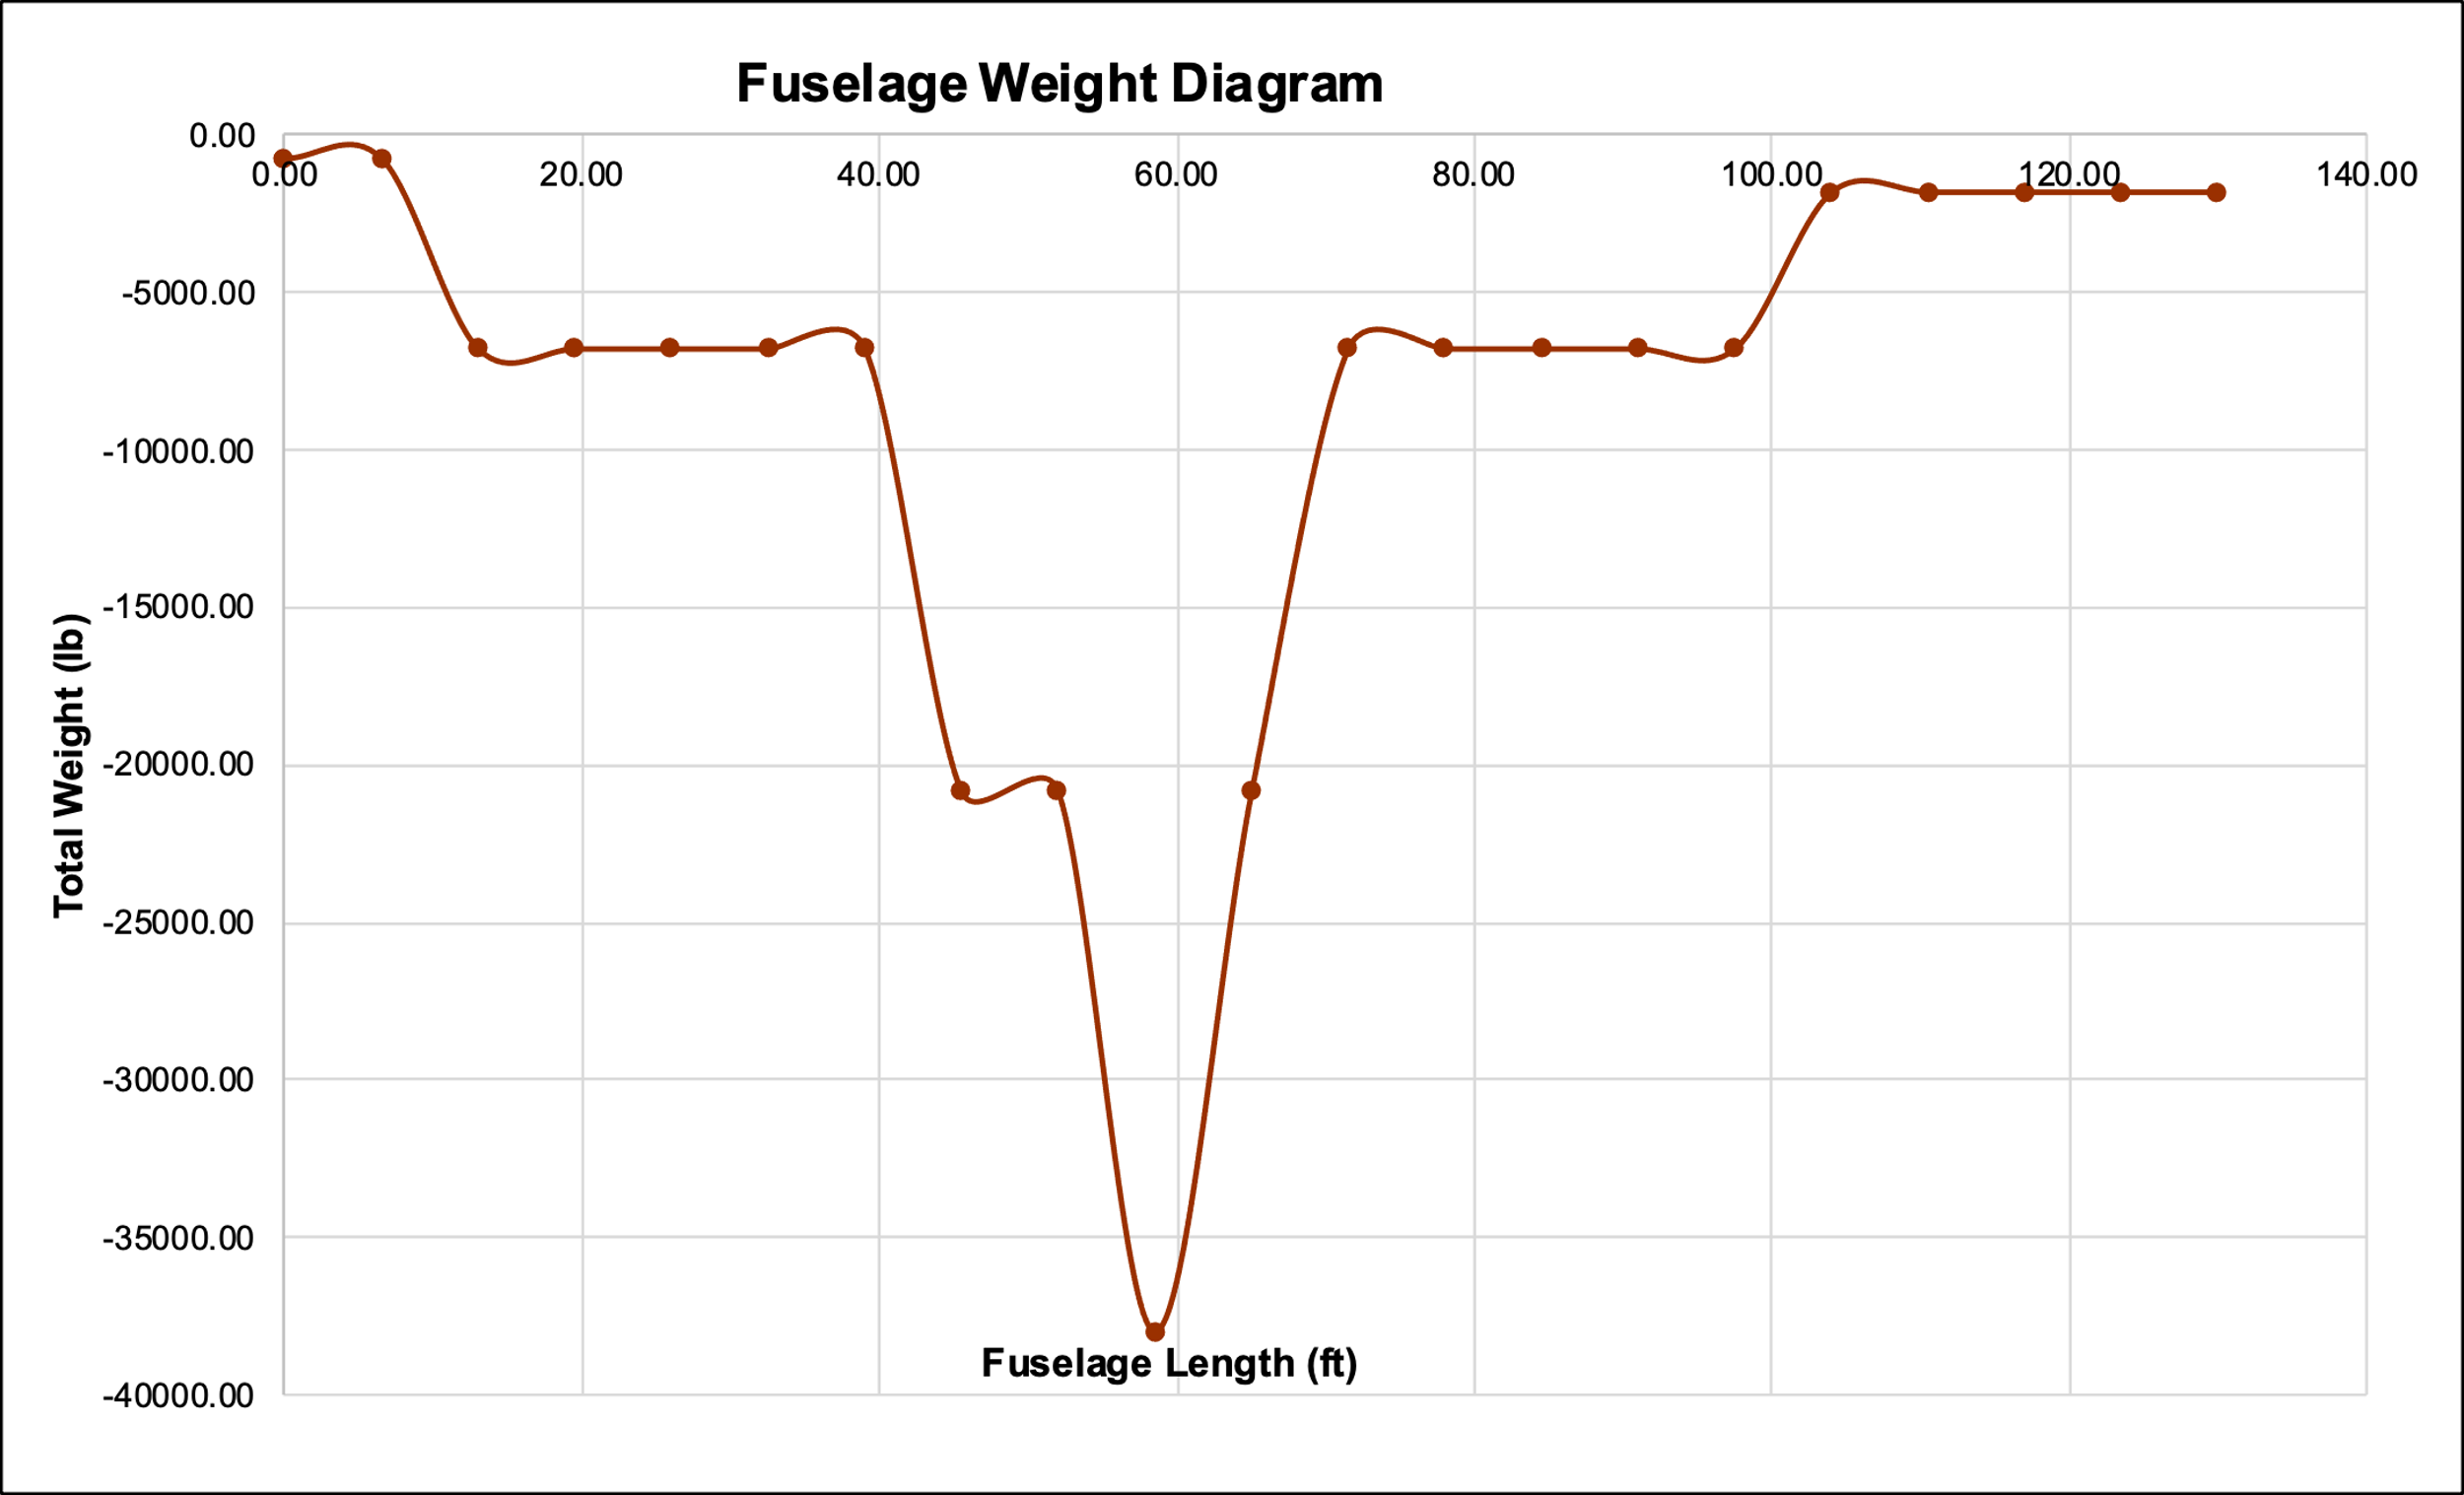
The airplane is in a stable configuration, as shown by the Static Margin (SM) of 0.308793071, probing an Average/Mean Aerodynamic Chord of 21.1 and an XCG/L of 0.448289414. A critical analysis of Figure 3: Fuselage Weight visualization exposes the weight distribution among the fuselage’s constituent parts. The methodology provides a solid robust for assessing the overall structural loading and its statistical ramifications for the aircraft’s balance and stability by providing quantitative clarity and precision to the various weight contributions in an airplane.
The rigorous statistical analyses performed in the pursuit of optimal wing performance reveal significant issues. Evaluating the data on wing load distribution, structural dynamics, and aerodynamic implications provides a more detailed comprehension of the issues impacting wing performance. The use of modern design characteristics refines these factors even further, integrating them with changing aerospace requirements. The study offers useful information on shaping wings for optimal efficiency by revealing the intricacies of the “Wing Load Distribution” section and exploiting available data. These aspects not only allow for improved aircraft performance but also contribute to the larger conversation about obtaining optimal wing functionality in modern aviation.
Wing Load Distribution
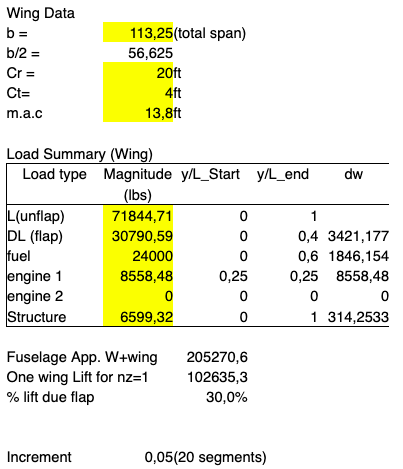
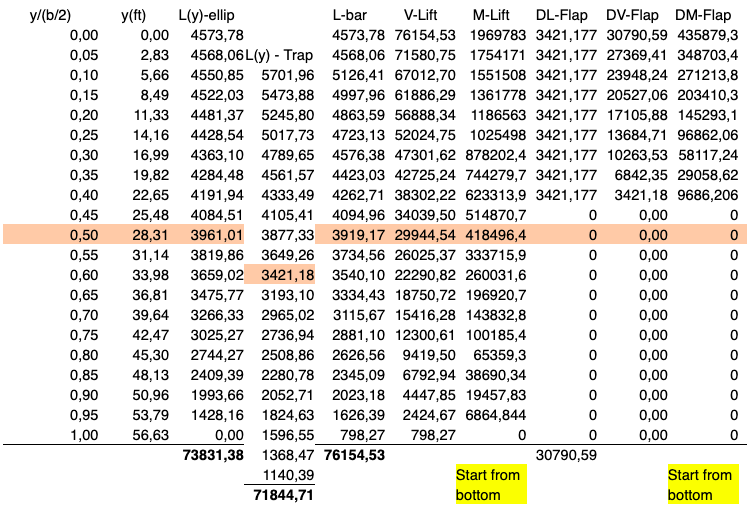
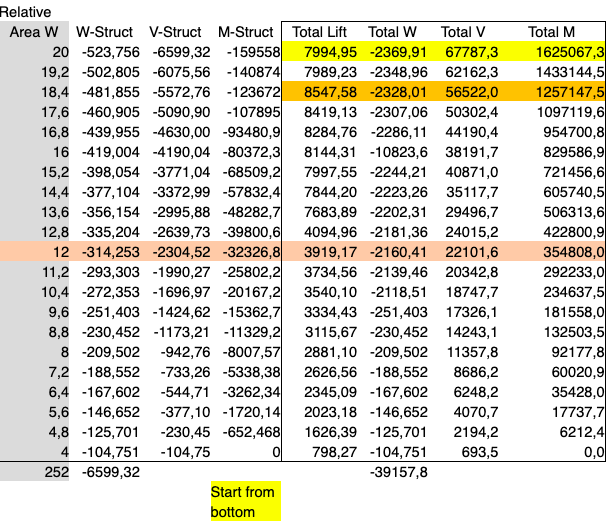
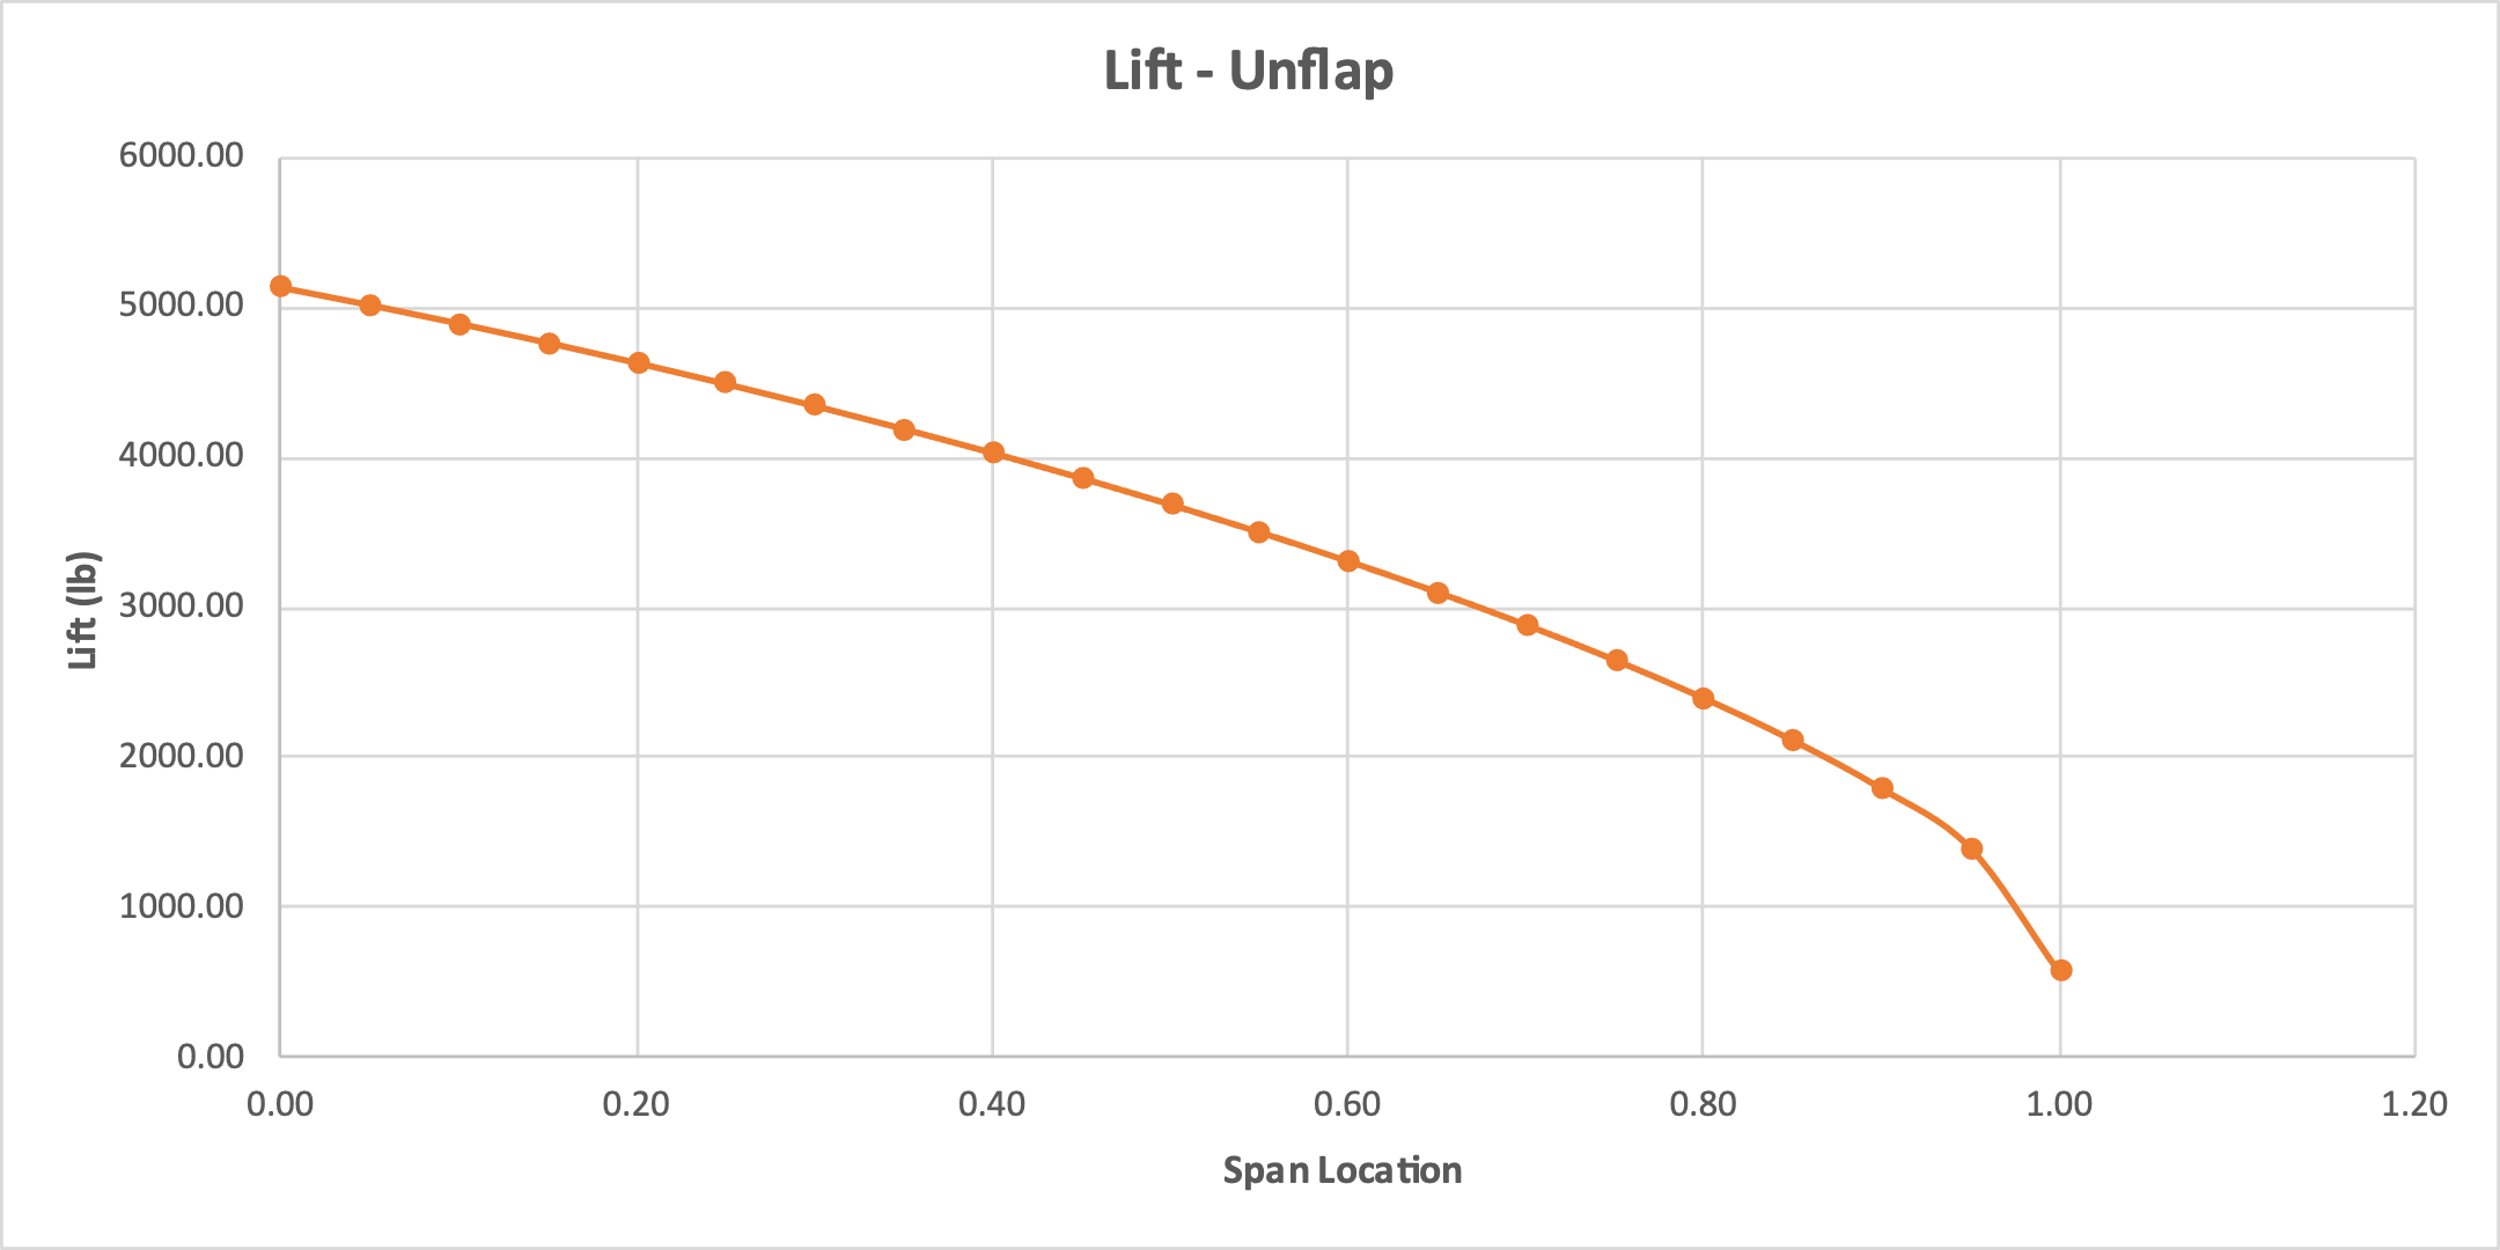
An extensive grasp of the aerodynamic forces at work is generated by the statistical analysis of the wing load distribution, which is bolstered by visualizations such as the lift un-flap (Figure 4), wing shear diagram (Figure 5), and wing moment diagram (Figure 6). The unflipped lift varies along the wing span, reaching a significant of 71844.71 lbs. at the root and decreasing towards the tip, as can be seen by looking at the lift distribution in Figure 4. Precise analysis of lift properties, which are essential for stability study, is made possible by this numerical exploration.
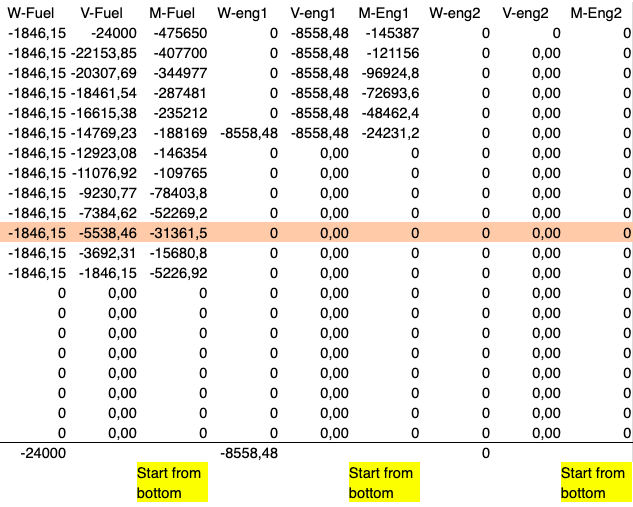
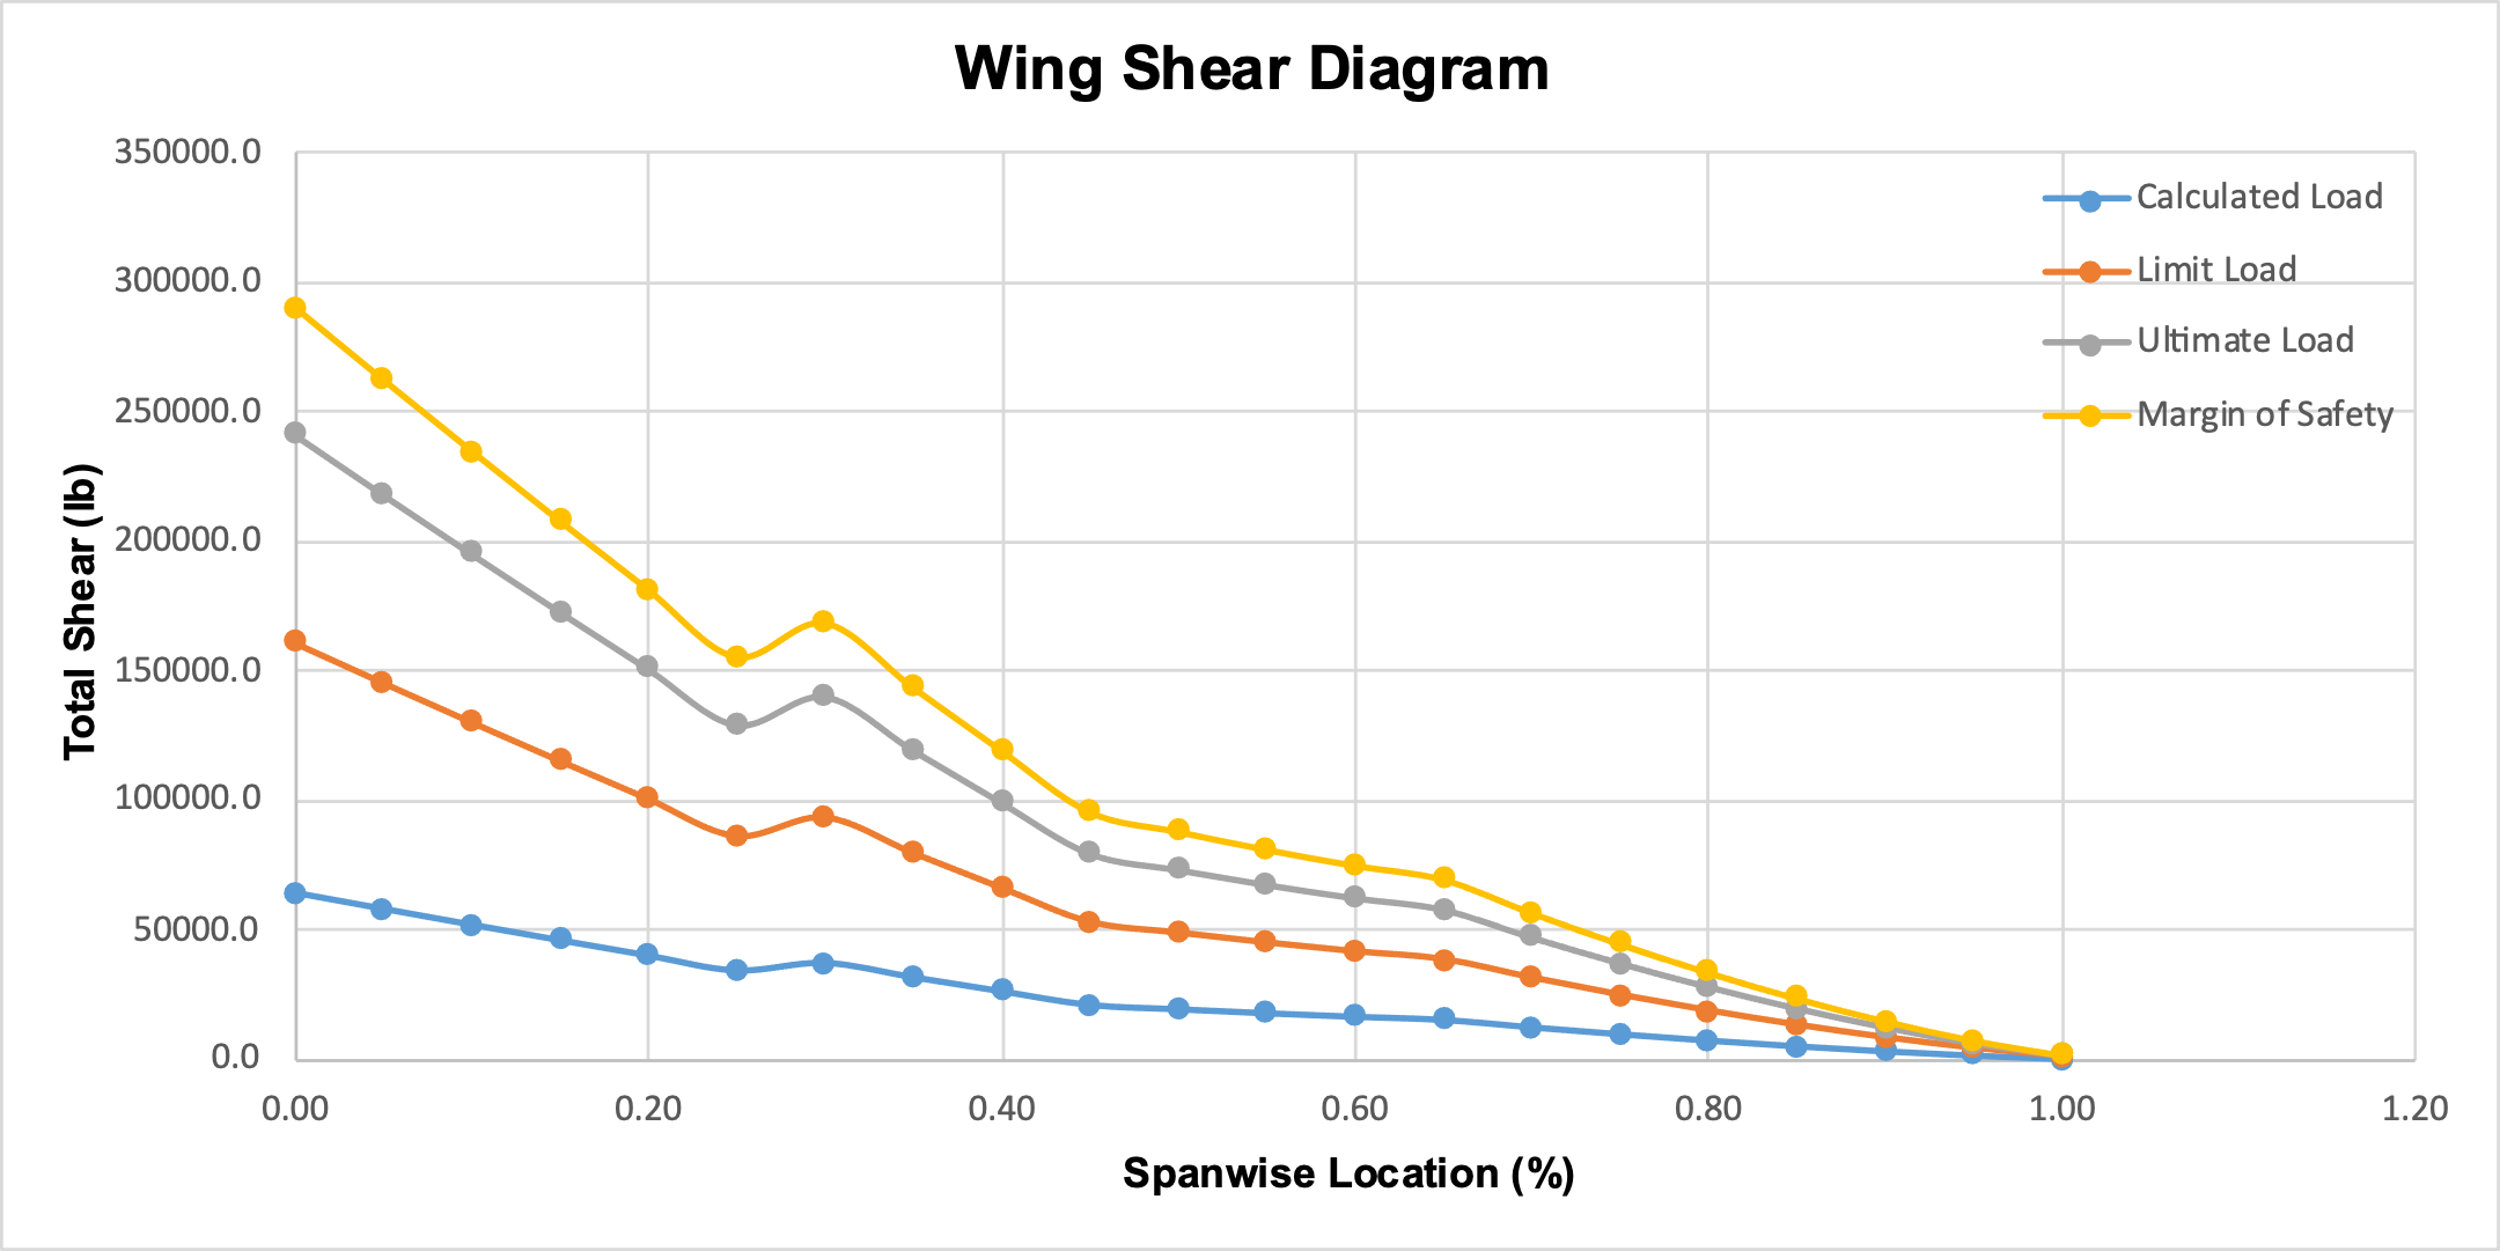
An in-depth numerical breakdown of the shear forces operating on the wing is exhibited in Figure 5: Wing Shear Diagram. Shear force, for example, is -8558.48 lbs. at the root, depicting a force direction and amplitude that are essential for structural concerns. The diagram’s numerical figures offer a substantial summary of the shear forces faced by the various wing segments. Similarly, Figure 6: Wing Moment Diagram offers sufficient numerical data regarding the moments that the wing experiences. For instance, the moment at the root, which represents the twisting impact on the wing structure, is -145387.179 lb.-ft. The comprehensive numerical stance makes it easier to analyze moments across the wing, which facilitates structural design and maximization.
For Lift Distribution
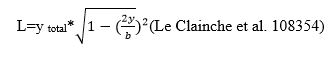
Given that; where:
- L(y) is the lift at a given spanwise location,
- L total is the total lift,
- b is the total wingspan.
Utilizing the given data;
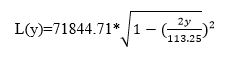
Calculating for y=0.1, 0.3, 0.5 (normalized by b)
L(0.1)= 69611.86
L(0.3)= 66418.04
L(0.5)= 62134.95
Shear Force Distribution
Summing the shear forces up to that point yields the shear force (V) at that point. The shear force distribution is obtained by calculating V(y) for each segment utilizing the provided load data (Fidan et al. 103).
V(y)=∑ Shear Forces Up to y
Moment Distribution
Incorporating the shear force distribution yields the moment (M) at any point along the wing span, the moment distribution is attained by performing numerical integration on each segment:
M(y)= ∑ Moments Up to y (Živković et al. 10671)
The rigorous statistical evaluation undertaken in the pursuit of optimal wing performance exposes significant concerns. A more thorough understanding of the problems affecting wing performance can be obtained by looking at the data on wing load distribution, structural dynamics, and aerodynamic repercussions. The employment of new design technology refines these factors even further, integrating them with new aerospace requirements. By exploring the intricacies of the “Wing Load Distribution” section and making use of the data at hand, the study offers crucial insights on forming wings for maximum efficiency. In addition to opening the door for improved aircraft performance, these elements expand our understanding of how to achieve the best wing functionality in the contemporary aviation sector.
Conclusion
Summary of Key Findings
This study’s critical findings provide a thorough comprehension of critical aerodynamic factors such as lift distribution, shear force, and moment distribution. The statistical study of these factors, using the available data, gives important insights about the aircraft wing’s behavior. The research highlights the importance of precise calculations in maximizing wing designs for improved performance, stability, and fuel efficiency. These findings have far-reaching consequences for the aerospace industry, providing a path to increased aircraft competitiveness through informed design decisions. Essentially, the study adds new insights to the science of aerodynamics and outlines the need for rigorous statistical analysis in the advancement of aircraft engineering.
Projected Impact on Aircraft Competitiveness
The research findings have far-reaching implications for advancing aircraft competitiveness. The work provides a foundation for maximizing wing designs by meticulously assessing lift distribution, shear pressures, and moment distribution. This endeavor has the potential to directly impact aircraft performance, stability, and reliability, resulting in a more competitive and sophisticated aerospace sector. Enhanced wing structures based on statistical analysis can result in aircraft with improved aerodynamic properties and lower fuel consumption. Such advancements not only fulfill current industry standards but also place aircraft manufacturers at the forefront of innovation, providing them with a competitive advantage. The anticipated ramification includes a paradigm transition towards more efficient and competitive aircraft, satisfying the aviation sector’s growing expectations.
Works Cited
Egan, Paul F. “Design for Additive Manufacturing: Recent Innovations and Future Directions.” Designs, vol. 7, no. 4, 2023, 83. Web.
Fidan, Ismail, et al. “Recent inventions in additive manufacturing: Holistic review.” Inventions, vol. 8, no. 4, 2023, 103. Web.
Kim, Hojong, et al. “Innovations in Building Diagnostics and Condition Monitoring: A Comprehensive Review of Infrared Thermography Applications.” Buildings, vol. 13, no. 11, 2023, 2829. Web.
Le Clainche, Soledad, et al. “Improving aircraft performance using machine learning: a review.” Aerospace Science and Technology, 2023. Web.
Živković, Milijana, Maša Žujović, and Jelena Milošević. “Architectural 3D-Printed Structures Created Using Artificial Intelligence: A Review of Techniques and Applications.” Applied Sciences, vol. 13, no. 19, 2023. Web.
Appendix A – Fuselage Plots
Appendix B – Wing Plots