Introduction
In our society presently, immunoassay techniques used in data analyses have assumed a place of high significance, particularly as it is applicable to pure/applied researches; where the techniques are adopted for such developments as ultrasensitive enzymatic immunoassays in antigenic and antibody analyses. Ultrasensitive/rapid enzyme immunoassays, have presented more current, flexible, and indeed expressive information that is considerably more applicable to scientific studies; particularly in pharmaceutics and related applied-research (Huston, et al., 1991; Wilczynski and Lukasik, 1994). In this regards, top quality antibodies/immunoassays constitute very vital basics for research-works conducted in the bio-medicals; in discovering new drugs, and in carrying out clinical diagnoses.
Monoclonal/polyclonal antibodies have been used in the development of ELISAs as well as for the development of antibody-suspension-array-based multiplicities using sets of biomarkers that are found to be highly connected to obesity, diabetic and cardiovascular disorders.
Equally, molecules of immunoglobulin, particularly IgG known to occur as intravascular/extra-vascular serum concentrations in adults, are of great significance in aiding the response of secondary antibodies (immunologic-memory) that are known to subserve a lot of impact towards host-defense against infections. Pertmer (1996), in a study concluded that reagents for immunology constitute the necessary support that keeps immunoassay systems up. The study further noted that:
‘Immunoassays can be utilized to quantitatively and qualitatively measure minute quantities of analyses in complex biological systems’ (Pertmer, et. al., 1996, pp.107).
Even though, the fundamental ideas that back a developing immunoassay could appear to be uncomplicated, developing an assay which provides unrealistic information is more obvious in selecting immunoreagents. An immunoassay uses several sorts of supports as well as detecting systems. But at the peak of immunoassays are antibodies which determine the level of sensitivity/specificity. Antibodies therefore constitute very vital components that make up the human immune system, and as well aid responses to infections (Pertmer, et. al., 1996; Bouts, et al., 2000).
This experiment will determine immunoglobulin g in human saliva and serum through the use of immunoassays (ELISA, in particular). The interest of the experiment, like several that are carried out on antibodies, will be in the detection and identification of specified antigens; including viruses and allergens. Studies have identified that based on the little quantity of targeted antibodies in a generalized sample a dilution performance could vary significantly depending on the measured target of the experiment (Huston, et al., 1991). The experiment will be based on measurement of the concentration of IgG in the following:
- Saliva;
- Serum antibody in test versus control samples; and
- Serum samples collected over a period of time.
The samples would be analyzed through the use of standards for producing curves by which calculation of concentration of IgG in the several samples would be based. Parametric controls will be used in confirming the presence of non-specified reactions (negatively on one end) and for conferment of the correct workability of the assay (on the other hand). Each sample is duplicate-screened.
Aim of the Experiment
The experiment is aimed at acquainting the student with knowledge of:
- Performance of an enzyme immunoassay;
- Data analyses through the use of a spreadsheet and linear regression; and
- Calculation of concentration of IgG in an unknown sample (where the student would appreciate changes in concentration as a result of viral infection).
Procedure
This experiment employs the usage of enzyme-immunoassay (EIA) as a tool for detecting and quantifying specified antigen-elicited molecules. Even though the tool is most applicable to conducting research or studies on clinical processes such as ones involving cancerous or autoimmune disorders, it is very effective in analyzing biologically based samples like plasma, urine, cell-extracts, or serum (Siber, et al., 1990; Roilides et. al., 1991; Ashman et al., 1992; Plebani et al., 1993; Drossou et al., 1995). The recognition of the antigen-antibodies is based on resultant antibodies that are unified with enzymes that catalyze reacting mixtures which are capable of causing a yield in the specified color of the sample. Through measurement of the color’s optical densities, the determination of specified molecules is achieved; this is because the color’s density is equivalent to the advanced reaction for the experimented result.
From studies conducted by Huston (1991), circulating IC-level was assessed through c1q ELISA approaches. It is noted that:
ELISA plates were coated with 10 µg/ml human C1q (Sigma) in 0.1 M carbonate buffer (pH 9.6), incubated for 48 h at 4°C, blocked for 2 h at RT with 1% BSA in PBS, and washed with PBS. EDTA-treated sera samples were added in serial dilutions starting at a 1/50 dilution and plates were incubated for 1 h at RT and overnight at 4°C (Huston, et al., 1991, pp.173).
The approach adopted by Huston above generated fruitful results, hence this is considered useful in our present experiment.
Results
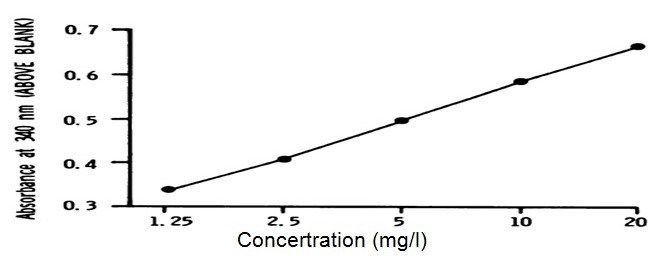
Figure 1 presents a plot of the absorbance (saliva data log antibody concentration) against dilution (on the x axis) using logarithmic scales; this has produced a slight sigmoid-curve. The graph identifies the behaviour of the assay which is under investigation through immunoassay.
It is figured that the possible error for the analyzed result is placed at -0.75% which reflects a standard deviational percentage error at 8.58%. To actualize accurate results, there was a testing of the assay through assaying the concentration with serum and an addition of diluted anti-human igG antibody. However, there were no noticeable inferences from the antibio 50ml of 2m.
In a similar experiment, Bouts, et al., noted that:
‘There are a number of methods for assaying aminoglycosides in serum’ (Bouts, et al., 2000, p.47).
For this particular experiment, its effectiveness is against the fact that:
‘Radioimmunoassays are expensive to perform and require expensive counting equipment, and the reagents have limited shelf lives. A new immunoassay, the homogenous reactant-labeled fluorescent immunoassay appears to overcome some of disadvantages’ (Vorechovsky et al., 1995, p.98).
An alternative to this approach could be the acetyltransferase which produces quite satisfactory results with the exception that it has to do with a scintillation counter.
Table of raw values
Discussion
Antibodies constitute very vital components that make the human immune system as well as aid responses to infections. It is thus very important to determine immunoglobulin g in human saliva and serum through the use of immunoassays (ELISA, in particular). The experiment is carried out on antibodies with the target of detecting/identifying specified antigens; including viruses and allergens. The result from the experiment identifies that based on the little quantity of targeted antibodies in a generalized sample; a dilution performance could vary significantly depending on the measured target of the experiment.
Statistical analysis
Statistical tests were conducted on the outcome of the samples to determine concentrations of IgG and sIgA with an ECC (p<0.05), and the following values were tabled
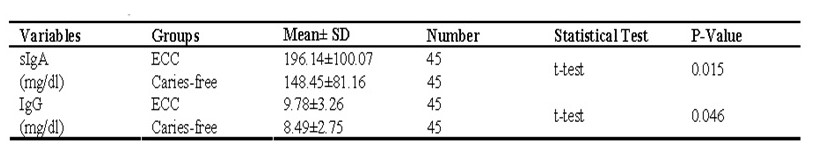
From the tests, there existed an insignificant inverse-correlation of salivary sIgA and incubation buffer concentrative levels (where the Pearson correlation was found to be -0.287), however, this is not quite significantly statistical (here p=0.056). The statistical analysis could not determine correlations linking salivary IgG and incubation buffer (as Pearson correlation was known to be +0.046) – more analysis is presented from a spreadsheet below:
Conclusion
The experiment presents a clear picture that in the saliva sample, the added material acted in the capacity of an amplifier; this is equally true at an instance where there are molecular bounds with antibodies and the added substance which would result to production of several signal molecules. As far as thought can permit, the added substance could continue to generate color without stopping; however, the greater the availability of primary antibodies in donor serums, the greater the chance for a binding of secondary antibodies and enzymes, hence the quicker the development of the color. An immunoassay uses several sorts of supports as well as detecting systems. But at the peak of immunoassays are antibodies which determine the level of sensitivity/specificity. The experiment hence identifies that assays constitute very vital components that make up the human immune system, and as well aid responses to infections. The recognition of the antigen-antibodies is based on resultant antibodies that are unified with enzymes that catalyze reacting mixtures which are capable of causing a yield in the specified color of the sample. Through measurement of the color’s optical densities, the determination of specified molecules is achieved; this is because the color’s density is equivalent to the advanced reaction for the experimented result.
One demerit of the indirect ELISA remains the non-specification of the antigen immobilization; especially at instances whereby there is the usage of serum as an antigen testing source; where the several protein substances constituting the sample could get stocked to the well of the microtiter plate. As a matter of fact, a little concentration of an analyze sample in a given serum would have to be in competition with a number of other serums to bring about appropriate well-surface bindings. Using a sandwich/direct ELISA makes available solutions to our examined sample, particularly through ‘capturing’ antibodies that are specified for testing the antigens as well as for pulling off the molecular mixed serum.
The running of ELISA could be achieved through either of quantitative or qualitative formats. However, a qualitative result would possibly make available a simplified negative or positive outcome (in the form of a yes/no) for a given sample. The determination of the off-yield that arises from the analysis is achieved statistically. When the quantitative ELISA is considered, the optical-density (OD) available in the sample is rested against the standard curve, which basically constitutes serial dilutions with known concentrations of a targeted module. As an illustration, in an instance where the test constitutes a 1.01 OD, a standard curve resulting to OD=1.01would have to belong to the sameanalyte concentrations.
Reference List
Ashman, R. F., et al., 1992. Genetic and immunologic analysis of a family containing five patients with common-variable immune deficiency or selective IgA deficiency. J Clin Immunol, 12 (4), pp.406-14.
Bouts, A.H., et al., 2000. Immunoglobulins in chronic renal failure of childhood: effects of dialysis modalities. Kidney Int, 58(2), pp.629-37.
Drossou, V., et al., 1995. Concentrations of main serum opsonins in early infancy. Arch Dis Child Fetal Neonatal Ed, 72(1), pp.172-F5.
Huston, D.P, et al., 1991. Immunoglobulin deficiency syndromes and therapy. J Allergy Clin Immunol, 87(24), pp.1-17.
Pertmer, T.M., Roberts, T.R., and Haynes, J.R., 1996. Influenza virus nucleoprotein- specific immunoglobulin G subclass and cytokine responses elicited by DNA vaccination are dependent on the route of vector DNA delivery. J Virol, 70(23), pp.6119-25.
Plebani, A. et al., 1993. Extensive deletion of immunoglobulin heavy chain constant region genes in the absence of recurrent infections: when is IgG subclass deficiency clinically relevant? Clin Immunol Immunopathol, 68(3), pp. 46-51.
Roilides, E., et. al., 1991. Serum immunoglobulin G subclasses in children infected with human immunodeficiency virus type I. Pediatr Infect Dis, 10(12), pp.134-9.
Siber, G.R., et al., 1990. Impaired antibody response to Haemophilus influenzae type b polysaccharide and low IgG2 and IgG4 concentrations in Apache children. N Engl J Med, 323(1), pp.1387-92.
Vorechovsky, I., et al., 1995. The PAX5 gene: a linkage and mutation analysis in candidate human primary immunodeficiencies. Immunogenetics, 42(9), pp.149- 52.
Wilczynski, J., and Lukasik, B., 1994. Transplacental transfer of antibodies to some respiratory viruses. Acta Microbiol Pol, 43(9), pp.347-58.