Results and Discussion
The key results of this laboratory work were direct measurements of analytical signals from fatty acid esters obtained using the classical instrumental GC/MS method. Since it is well known that this technique uses a reference method, the organic methyl caprate with a reference peak value was chosen as the internal standard1. Since GC/MS focuses on using the molar mass of the molecule as one of the central predictors of substance movement across the chromatographic column, the weights of the mixture components analyzed were emphasized in the present laboratory work. Table 1 clearly summarizes the list of the four esters used in the experiment.
Table 1. Summary of the standard solutions used.
It should be noted that the methyl caprate in the first row was used as the reference material against which the subsequent calculations for the three fatty acid esters were made. As can be seen in Table 1, there is an unambiguous relationship between the molecular weight of the sample and the retention time on the chromatographic column. The heavier the molecule, the lower its rate of movement, and thus the more significant the time required to elute the substance. This relationship was confirmed for the four substances studied, for which the heaviest, methyl arachidate, had approximately twice as much total retention time as the lightest, methyl caprate. Consequently, it can be assumed with high probability that there is a positive linear relationship between the molecular weight of the sample and the retention time metric.
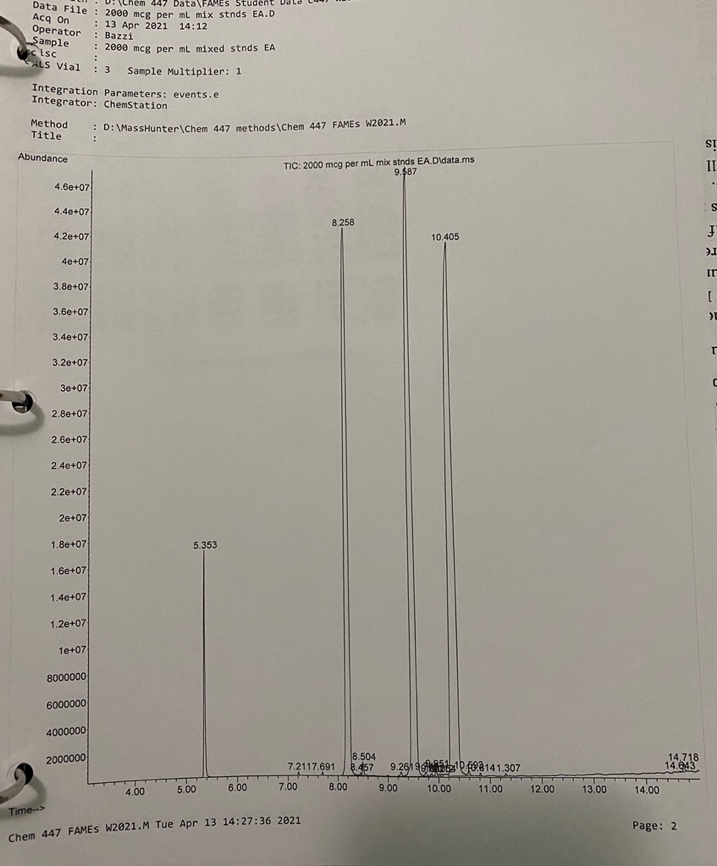
In the present laboratory work, registration of the analytical signal was performed using a mass spectrometer, which determines the signal intensity depending on the fragmentation of the molecule. Thus, it is known that the more complex and massive the substance, the more diverse the final mass spectrogram. More specifically, for a mixture of four standard solutions (three esters and one internal standard), the spectrogram shown in Figure 1 was obtained. Analysis of this Figure allows us to determine that the area of each of the peaks is different and is determined mainly by its height. Thus, the more intense the signal from the sample was, the larger the area it could have as a result. In addition, the concentration of the substance also played an essential role in the formation of the peak since it directly contributed to the overall rate of movement of the molecules and thus affected the intensity of the signal.
The ratio of the peak area of the standard solution to the peak area of the internal standard was defined as the peak ratio. In order to determine the dependence of the peak ratio on the concentration of the dissolved substance, a linear regression model was used. Figures 2, 3, and 4 show plots of the dependence of the peak ratio on the concentration of the corresponding fatty acid ester. In general, it can be seen that each of the Figures can describe the dependence with relatively low reliability. The best fit of the linear regression model was found for the heaviest molecule, that is, methyl arachidate.
Finally, it should be noted that the use of standard solutions of fatty acid esters was conditioned by the assumption that the unknown concentration of the substance could be determined by means of a calibration graph. For this purpose, a portion of the combined mixture of the known standard and some solution of unknown concentration was introduced into the GC/MS analyzer. The calculated new peak area, when divided by the peak area of the mixture of the internal standard with the unknown, gave a new peak ratio for each ester in a series of three measurements with a difference in volume. The final Table 2 is a summary of all three lines of the experiment. The third column provided information regarding the concentration (ppm) of the corresponding ester in the mixture, while the fourth column summarizes the concentrations of the unknown additive.
Summary
In the present laboratory work, the possibilities of practical chemical analysis of substances using a GC/MS unit were investigated. It was shown that the retention time of the substance in the chromatographic column is a value linearly dependent on the molecular weight. In more detail, the heavier the molecular weight of the substance, the longer it eluted. In addition, standard solutions were used to construct gradient plots in order to subsequently determine the fatty acid ester concentration in each of the mixtures with the unknown. Since the linear regression model did not have high reliability for all experimental lines (the highest figure was R2 = 0.7064), one cannot unequivocally judge the value of the data obtained. Finally, it was shown that the concentration of the substance was related to the peak area on the spectrogram: this relationship was due to the inhibitory effect that increasing the concentration had on the velocity of the molecules in the column.
Reference
Avula, S. G. C.; Belovich, J. M.; Xu, Y. Determination of Fatty Acid Methyl Esters Derived from Algae Scenedesmus Dimorphus Biomass by GC–MS with One‐Step Esterification of Free Fatty Acids and Transesterification of Glycerolipids. J. Sep. Sci. 2017, 40(10), 2214-2227.