Numeracy is an individual ability that is applied to basic numerical concepts. The fundamental numeracy skills include adding, subtracting, multiplying and dividing (Steen 2001). Numeracy is a practice that involves numerical and graphical information (McIntosh 2004).
Data collection commands keenness because inaccurate data collection may lead to invalid results (Purcell, Elias, Davies & Wilton 2005). The current research results show a random test on thirty different students who visit the UCLAN student portal weekly. According to Elias and Purcell (2004), researchers collect data on situational characteristics to influence a variable. In the current study, an interview is used to yield responses from a sample of thirty interviewees. The participants provide data about their purposes for visiting the student portal each week. The results of the interviews are tabulated using basic numeracy skills before being analysed. The following table will guide the study:
The purpose of the research was to evaluate the students’ interactions with the UCLAN web portal and to estimate who and why employs this portal the most. This research is important for the development of the website based on the needs of the learners. From the table above it is noticeable that the majority of the students come to the portal to check their email which means that the main purpose of the website is to provide communication between students and tutors or between learners as peers. Based on this data it may make sense to provide certain improvements concerning the website’s functions as a portal for communication. A presentable and user friendly web portal could attract more learners and also encourage active and independent learning, group activities for students, social interactions via the internet, and collaborative learning. These improvements would increase the popularity of the UCLAN web portal and improve its functionality in terms of learning benefits and diverse teaching methods practiced by the tutors.
The research also made the demographics of the students who visit it. During the data collection I mainly targeted the gender representation rates in order to see the statistical correlation between the male and female users of UCLAN portal and their activities there.
Besides, the purpose of the research was to estimate the activeness of the students in terms of their visits to the web portal. I wanted to research the attending patterns of the students and how often they use the website. My general purpose was to determine the overall relationship of the students towards the web portal based on such characteristics as the frequency of visiting, the activities student carry out when they attend the website, and who are more common users of the website.
The method chosen for data collection for this research is interview. In the initial state of preparation for the collection of quantitative data it was planned to work out a set of questions for the interviews. The questions targeted the demographic characteristic of the respondents, gender, age and ethnicity namely. Besides, the questions were designed to collect information concerning the use of the UCLAN web portal. The interviewees were to provide the statistical data about the frequency of their visits to the website and the purposes of their visits.
The data was sorted individually for each respondent, and then divided into several categories. First one was gender composition, second one targeted the frequency of their visits to the UCLAN portal and purposes of the visits, last one documented ethnicities of the respondents. For the convenience of future processing the data was organised in a form of a table presented above which made the process of analysing and hypothesising much easier. Further, charts were developed in order to provide visual demonstration of the hypotheses and their success.
Data analysis
Thinking quantitatively plays a central role in the application of basic mathematical skills (Bekhradnia, Whitnall & Sastry 2007). Quantitative reasoning considers quantitative evidence in evaluating, constructing, and communicating mathematical arguments in personal life (Brown 2003). The data is formulated and represented using descriptive statistics of charts and tables.
Fractions and averages
An average is a sum of all the numbers divided by the total quantity of the numbers in the list. For instance, average number of females in the study is 20/30, which gives a mean of 0.67. In contrast, fractions may be applied to show parts of a whole (Brown & Hesketh 2004). The numerator signifies the number of parts in a lot. The denominator reflects the parts equal to the size to which a whole is divided. For example, in the class, ten out of thirty are males (10/30), twenty out of thirty (20/30) are females. The two fractions are read as ten thirtieths, and twenty thirtieths, which when simplified further are a third (1/3) and two thirds (2/3) respectively. This concept is presented in a diagram:
Decimals and Ratios
Decimals come from a system with a base of ten, meaning that the decimal system exists in bundles of ten (Chevalier 2002). A point separates ones and tenths in a number in order to create an extension of a whole number. From the results of the survey, ten males out of thirty females are written using similar annotations. A ratio is also applicable in translating the figure as a comparison to the other. The ratio is represented as 1:3. A third translates to 0.33 and is applicable where accuracy is required for measurements.
Relating fractions, decimals and percents
One can represent fractions and whole numbers, which are rational numbers, as fractions, decimals, ratios, and percentages. Percent refers to a hundredth, meaning that they are rational numbers with 100 as the denominator. For instance, 16 students of British ethnicity out of class of thirty are represented as 16/30 while the percentage is 16/30 times 100. The result of the figure is written as 53.33% as the chart below presents. The number of Pakistani students is represented as 4/30, which is 13.33%. The representation of Arabs is 3/30 or 10%.The Chinese are 7/30 or 23.33% of the whole class. Since the decimal points associated with 0.33333 are infinite, they should be rounded off or approximated if they are to be used in mathematics.
Hypothesis testing
The predictive research aims to test the recurrence of portal visits each week by students. The research predicts certain phenomena based on a set of hypothesised relationships. The following hypotheses explain the why, how, and where of the research to answer similar events in future.
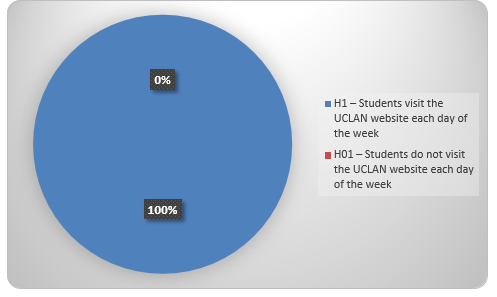
Hypothesis 1
- H1 – Students visit the UCLAN website each day of the week
- H01 – Students do not visit the UCLAN website each day of the week
The results of the study show that thirty out of thirty students visit the UCLAN student portal each week. This response confirms Hypothesis H1 as true. The results of the study are represented below.
Hypothesis 2
- H2 – Majority of the students visit the UCLAN website to check their mails
- H02 – Majority of the students do not visit the UCLAN website to check their mails
The data analysis shows that 23/30 of the students visit the students’ portal to check their mails each week. This confirms that hypothesis H2 is correct. The data is represented below.
Hypothesis 3
- H3 – Majority of the students who visit the UCLAN website are males
- H03 – Majority of the students who visit the UCLAN website are females
From the results of the survey, majority of the students (20/30) who visit the website are females. This confirms that H03 is true.
In sum, numeracy acts in conjunction with numeracy skills. Quantitative reasoning allows for the critical application of mathematical and statistical skills in interpreting data, drawing conclusions, and solving problems. From the study, quantitative reasoning requires mathematical skills learned in high schools. The collected data, allows the study to formulate and analyse the findings of data.
Bibliography
Bekhradnia, B, Whitnall, C & Sastry, T 2007, The academic experience of students in English universities, Higher Education Policy Studies Institute, Oxford, UK. Web.
Brown, P 2003, ‘The Opportunity Trap: Education and employment in a global economy,’ European Educational Research Journal, vol. 2, no. 1, pp. 141-179. Web.
Brown, P & Hesketh A 2004, The mismanagement of talent: employability and jobs in the knowledge economy, Oxford University Press, Oxford, UK. Web.
Chevalier, A 2002, Just Like Daddy: The occupational choice of UK Graduates, Royal Economic Society, Oxford, UK. Web.
Elias, P & Purcell, K 2004, ‘Is mass higher education working? Evidence from the Labour Market Experiences of Recent Graduates,’ National Institute Economic Review, vol. 190, no. 1, pp. 60-74. Web.
McIntosh, S 2004, Further Analysis of the Returns to Academic and Vocational Qualifications, HMSO Publications, Norwich, UK. Web.
Purcell, K., Elias, P., Davies, R. and N. Wilton 2005, The Class of ’99. A study of the early labour market experiences of recent graduates, DfES Publications, Nottingham, UK. Web.
Steen, L 2001, Mathematics and Democracy: The Case for Quantitative Literacy, The Woodrow Wilson National Foundation, Los Angeles, US. Web.