Introduction
Analyzing the rates of defective goods production in a company is an essential step towards improving the company’s quality standards. The firm in question has been delivering rather unsatisfactory results; however, the manager claimed that the staff does not produce more than seven defective items per week. The application of a two-sided t-test will reveal the current score of the firm and provide further directions for its development.
Null Hypothesis
The number of defective items, which the staff members produce on a weekly basis, is less than seven.
Alternative Hypothesis
The number of items, which the staff members produce on a weekly basis, is more than seven.
Statistical Data Analysis
T-Test Value
Based on the information provided in the test results, it is quite possible for the alternative hypothesis to be correct.
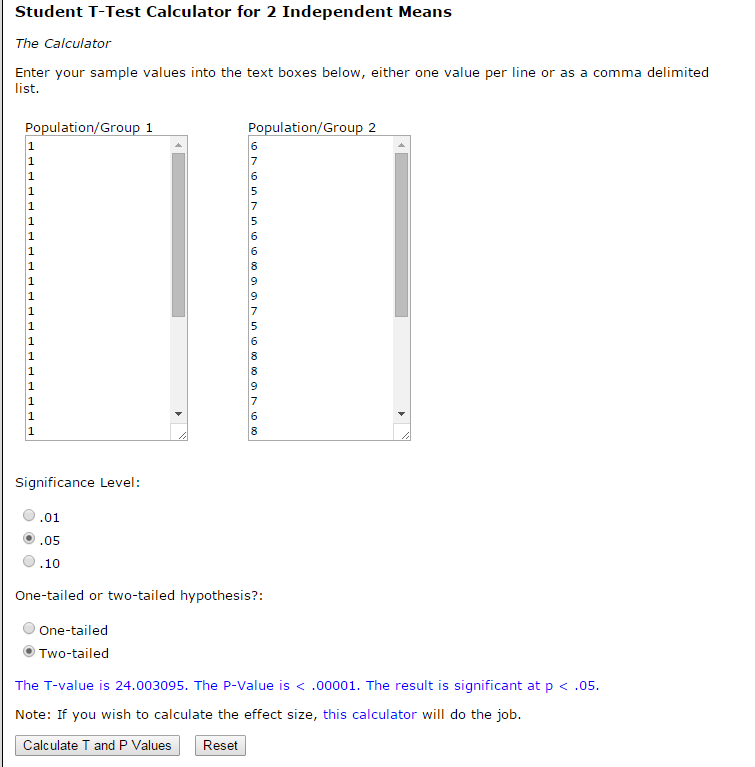
In other words, the fact that the t-test results have delivered the t-value of 24.003095 shows that there is a considerable difference in the number of defective flash drivers produced, as well as the fact that the specified quantity is likely to exceed the average amount of seven drivers per week.
The average quantity of drivers per week as estimated with the help of the calculator mentioned above also shows that the mean value thereof is slightly above the number predicted by the company manager. Although 7.33 errors in the production process made on a weekly basis and, therefore, 7.33 defective items produced are rather similar to the seven errors predicted by the manager, the number retrieved in the course of the test still exceeds the stated one, which makes the claim made by the company manager invalid (Rohatgi, 2013).
P-Value
As the outcomes of the statistical test in question show, the p-value of the data set represented in the statistical test outcomes displays clearly that the null hypothesis needs to be rejected. In other words, the fact that the number of defective items will not exceed the stated quantity (i.e., seven per week), unfortunately, has to be denied, as the test outcomes show quite clearly that there is a strong tendency for the company staff to deliver less positive results.
In other words, the fact that the p-value of the data sets under analysis is below the threshold that allows identifying the null hypothesis as valid (Marschner, 2014), it can be assumed that the number of mistakes made by the employees over the course of a week is more than seven. To be more exact, the alternative hypothesis, which states that the employees make more than seven mistakes in a week in the course of the production process can be considered confirmed.
Decision
Based on the data retrieved in the course of testing, one may assume that the null hypothesis, which states that the staff does not exceed seven defective items in the course of the production process can be rejected. To be more exact, the total quantity of the items that will later on have to be excluded from the lineup of the company’s goods makes approximately 7.3. The above-mentioned fact leads to the conclusion that the quality standards accepted by the organization will have to be changed along with the values and organizational behavior of the employees. Specifically, a set of more rigid standards will have to be introduced; moreover, it is highly desirable that the ethical principles, which the employees are guided by in the workplace, should be upgraded so that the staff members could work towards attaining higher customer satisfaction rates.
Conclusion
The outcomes of the statistical test taken to verify the hypothesis have shown that the organization needs to update its quality standards. The null hypothesis has been proven wrong since the t-value turned out very high and the p-value could not be identified as significant. Therefore, the alternative hypothesis had to be recognized as valid.
Reference List
Marschner, I. C. (2014). Inference principles for biostatisticians. New York City, New York: CRC Press. Web.
Rohatgi, V. K. (2013). Statistical interference. Mineola, New York: Courier Corporation. Web.