Abstract
This experiment aimed at using UV-Vis absorption spectra of different conjugated cyanine dyes to uncover the molecular attributes of the dye molecules. Three unknown solutions A, B, and C were diluted to various concentrations and their absorbance values determined using UV-Vis spectrophotometry. Various plots were made to determine the size and bond lengths of the dyes. The absorbance values were lower than the target absorbance of 0.8. The observed λmax values were 710, 526, and 610 nm for dyes A, B, and C, which were identified as dicarbocyanine, carbocyanine, and cyanine respectively. The lengths of dyes A, B, and C molecules using the conjugated chain assumption were 1.15E-09, 5.69E-10, and 8.57E-10 meters respectively. The extinction coefficient was 5000 for all three dyes. It was concluded that UV-Vis was a reliable method of determining chemical and physical attributes of conjugated dyes.
Introduction
Color perception occurs when the light of different wavelengths is reflected by the light receptors in the eye. Newton deduced that objects do not have specific colors.1 Instead, surfaces reflect certain colors and absorb others. Consequently, only the reflected colors reach the eyes. Many compounds take in ultraviolet (UV) rays, which are also referred to as visible light. The specific wavelengths associated with UV rays range from 190 to 750 nm. The amount of light absorbed can be expressed as transmittance or absorbance.2 Transmittance values reduce as absorbance values increase and vice versa. This relationship is explicated by Beer Lambert’s law which states that A=ℇbc. In this equation, A is absorbance, ℇ is the molar absorptivity measured in mol-1 cm-1, b is the path length in centimeters and c is the concentration of the compound expressed in moles per liter.3 Spectrophotometry is a chemical technique that exploits Beer’s law to determine the concentration of solutions.
Many molecules absorb ultraviolet or visible light based on Beer’s law. An absorption spectrum indicates several absorption bands that match the functional groups within the molecule.2 The outer electrons of molecules are excited following the absorption of UV or visible light.3 However, inorganic molecules, the absorption only occurs in specific functional groups known as chromophores.4 The valence electrons in chromophores require low excitation energy. Absorption can be measured using a spectrophotometer.
A UV-visible spectrophotometer uses light that spans the ultraviolet and visible range of the electromagnetic radiation spectrum.5 It comprises a source of light, monochromator, collimator, sample cuvette, wavelength selector, a photoelectric detector, and a display. The Cary 50 is an advanced spectrophotometer that applies the same principle but uses a Xenon flash lamp. These modifications make it advantageous over conventional UV-Vis spectrophotometers.
Apart from measuring concentrations, spectrophotometry can be used to determine the molecular characteristics of substances. The particle in a box model is a quantum mechanics exemplar that portrays a particle capable of moving in a small space enclosed by impassable walls. This model has immense applications in optoelectronics involving compounds such as conjugated polyene systems. Such systems can be represented as a one-dimensional box whose length is the same as the overall bond expanse from one end of the polyene to the other. Absorbance spectra together with a modification of the particle-in-a-box model can be used to solve for the size of molecules. Therefore, the main research question is whether spectrophotometry can be used to determine the molecular features of conjugated polyene dyes.
The chemicals and equipment used in the experiment as well as their details of manufacture are included as follows:
- 1,1’dietheyl-2,2′-cyanide iodide CAS NO. 977-96-8, Eastman Kodak Company,
- 1,1′-diethyl-2,2′-carbocyanine iodide CAS NO. 605-91-4, Aldrich Chem. Co,
- 1,1′-diethyl-2,2′-dicarbocyanine iodide CAS NO. 14187-31-6, Eastman Kodak Company,
- Methanol, VWR chemicals,
- UV-vis spectrophotometer, Cary 50 Probe,
The structures of the molecules used in the experiment are indicated below.
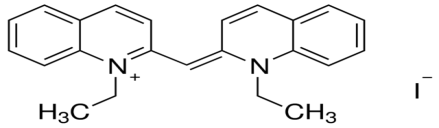
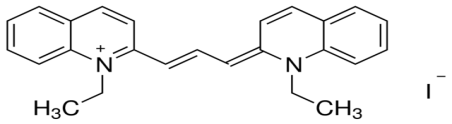
1,1’dietheyl-2,2′-cyanide iodide 1,1′-diethyl-2,2′-carbocyanine iodide
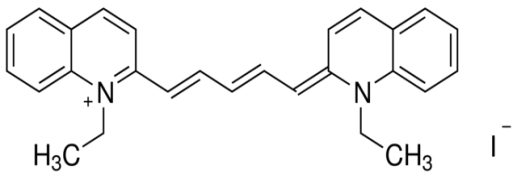
1,1′-diethyl-2,2′-dicarbocyanine iodide
The purpose of the experiment was to use UV-Vis spectrophotometry to unravel the molecular features of different dye molecules. The calculations used in this process were based on the following equations.
M1V1 = M2V2 ……(1)
A = εbc ……..(2)
E=hc/λ……… (3)
 ……………(4)
![]() ………….. (5)
………….. (5)
L = (b x l) + y ……..(6)
Method
Solutions A, B, and C of targeted absorbance of 0.8 were prepared from stock solutions of 0.995, 0.1, and 0.999 mM. The target molarity of 0.0016mM was attained by diluting the stock solution with methanol-based on the equation M1V1= M2V2 where M1 was the concentration of the stock solution, M2 was the concentration of the target solution, V1 was the volume of the stock solution, and V2 was the volume of the target solution. The volumes of the stock solutions used were 16.08, 16.00, and 16.02 µL for dyes A, B, and C respectively. The spectrophotometer was calibrated using methanol and used to read and record the UV-vis spectrum of the compounds.
Results
The absorbance of the spectra observed was lower than the target absorbance of 0.8. The observed λmax values were 710, 526, and 610 nm for dyes A, B, and C respectively. The lengths of dyes A, B, and C molecules using the conjugated chain assumption were 1.15E-09, 5.69E-10, and 8.57E-10 meters respectively. The extinction coefficient was 5000 for all three dyes, which was lower than the predicted ones. Details regarding the results are included in Tables 1 to 6 and Figures 1 to 4.
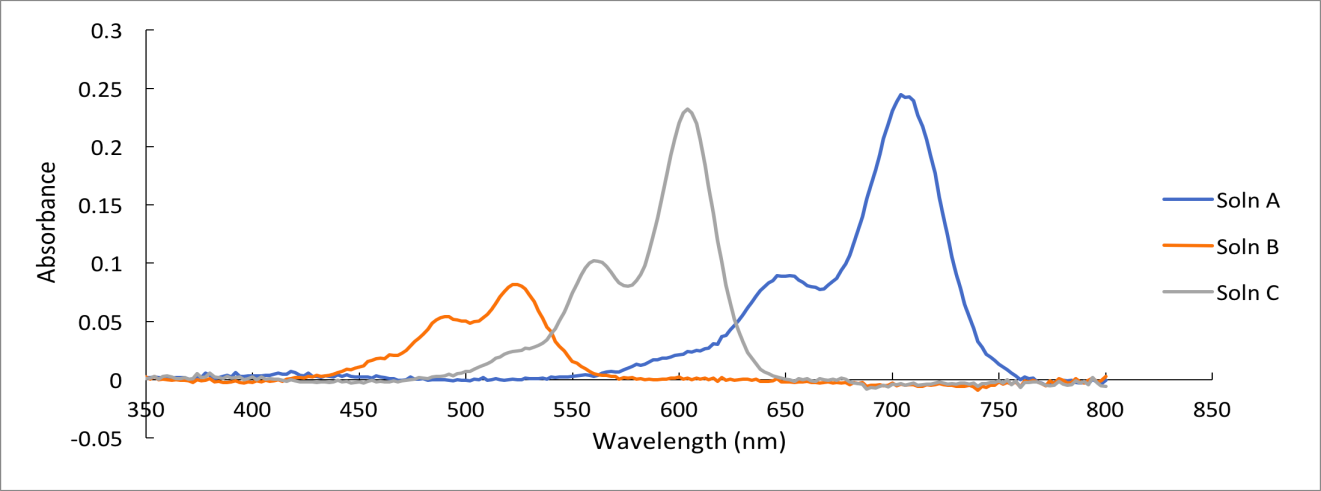
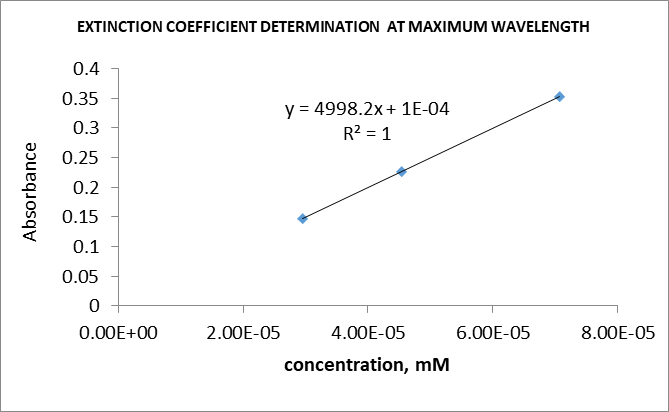
Table 1: Extinction coefficient of various dyes (from the class data).
Table 3: L in conjugated molecule protocol.
Table 4: L in whole molecule protocol.
Table 5: Length (L), electrons (N), and λmax.
The slope is l = 1E-10.
Table 6: Values of L using λ1/5.
Table 7: HOMO-LUMO energy and wavelength.
Discussion
The UV spectra of dyes A, B, and C were similar in the pattern of peaks. A smaller peak was formed at a lower absorbance, whereas a second peak was formed at a higher absorbance (Figure 1). The spectra differed in the wavelengths at which the peaks are formed. Each dye had its wavelengths where absorbance maxima were noted, thereby indicating that the three dyes were different. Based on the literature values and observed λmax values, solution A was dicarbocyanine, B was carbocyanine, and C was cyanine. The concentration of each dye solution was 0.0016M. An increase in concentration increased the absorbance value hence leading to high peaks in a UV-Vis spectrum of a molecule.
The extinction coefficient or molar absorptivity is a constant value that indicates the extent of absorbance of a molecule at a given wavelength.6 This parameter can be determined experimentally by diluting a dye to various concentrations ranging from low to high. The absorbance of each solution is then measured and recorded. A plot of absorbance versus concentration is then plotted. A straight-line graph should be produced. The slope of the graph gives the extinction coefficient of the dye. The independent variable is the concentration, whereas the dependent variable is the absorbance.7 The extinction coefficients for all the dyes were 5000.
Mixing dyes interferes with the extinction coefficient and the resultant absorption spectrum. When dyes A and C were mixed, the spectrum in Figure 3 was produced.
Comparing Figures 1 and 2 showed that the λmax values in both spectra were at approximately 610 nm and 710 nm. The difference was the individual graphs had four distinct absorbance maxima, whereas the combined graph had only two distinct peaks. Therefore, it was noted that Beer’s Law did not apply accurately to mixtures because components interacted in mixtures leading to variations in absorbance values. Hence, the observed and predicted absorbance of the dye mixtures were not equal.
UV-Vis can be used to identify molecules in mixtures because different molecules have distinct λmax. The presence of a known peak in a solution indicates that the mixture contains a specific compound or functional group.8 The main limitation of using UV-Vis spectroscopy to identify molecules is that at high concentrations, the charge distribution and refractive index are affected, which alter the absorbance.9
Nevertheless, UV-Vis spectrophotometry can be used to elucidate the size of molecules using equations 4, 5, and 6. Different protocols based on varying assumptions have been proposed to determine the length of a molecule. The conjugated molecule protocol (assumption b) produced the outcomes in Table 3, whereas the whole molecule protocol (assumption a) generated the data in Table 4. Comparing the two protocols with the experimental data showed that the experimental values of λmax agreed with the predicted trend. The estimates from assumption (a) gave better agreement with the values of calculated L, which implied that electrons in the molecular orbitals responsible for the spectral transition span the entire molecule.
Equation 6 can also be used to determine the average length of the C-C bond. From equation 6, b is the independent variable, whereas the dependent variable is L. Plotting b versus L gives l as the slope and y as the y-intercept. It has also been hypothesized that λ1/5 gives a better estimate of L as opposed to λmax. This hypothesis was tested and demonstrated in Table 6. It was evident that the value for the typical length of a carbon-carbon bond in a conjugated chain better supported the use of λ1/5 in this analysis.
The wavelengths corresponding to the HOMO-LUMO energy gap were 435.64 nm, 238.31 nm, and 370.62 nm for dyes A, B, and C respectively (Table 6). Conversely, the wavelengths used to calculate the value of L are 392.84, 97.01, and 220.07 nm for dyes A, B, and C in the conjugated molecule protocol and 1206.98, 964.234, and 1082.207 nm for dyes A, B, and C in the whole molecule protocol. The observed wavelengths are 710, 526, and 610 nm for dyes A, B, and C. The conjugated molecule protocol gives a better agreement. Increasing the width of the potential well has been shown to reduce the energy levels in the well.10 Likewise, increasing the length of the conjugated chain in the dye molecules reduces the λmax for the dye molecules. Consequently, energy levels in the infinite square have higher energy than the corresponding level in the finite square well.
The lowest energy transition that can occur in the dye is the HOMO-LUMO transition because the energetically favorable promotion of electrons is usually from the highest occupied molecular orbital to the lowest occupied molecular orbital, thereby leading to an excited state. When light from a spectrophotometer hits a dye molecule, the atoms in the molecules that are at ground level absorb photons of light. The energy from the photon excites the electrons in the atoms to a higher energy state. The excited electrons are unstable and fall back to a lower energy level in a process called transition. During the transition, the electrons emit a photon whose magnitude is equal to the energy gap between the excited and second state.
Spectroscopy can be used to determine the concentration of a molecule using the Beer-Lambert law. The molar absorptivity at a specific wavelength and path length of the solution must be known. The absorbance of the solution at the specified wavelength is measured. The values are then substituted into the above equation and used to solve for c. This process is done by dividing the absorbance by the product of the molar absorptivity and path length.
Dyes in solution interact due to the forces that lead to the binding of dyes onto fibers. The association may occur between similar molecules or different molecules. However, the spectrum of a dye mixture does not represent the sum of the spectra of the individual dyes as seen in the individual spectra of dyes A and C as well as the combined spectrum of the two dyes. If the representation were a sum of the spectra, the first peak for the combination spectrum would be expected to have double the absorbance of the two peaks. The spectrum represents an average of the spectra of the individual dyes as seen in the average λmax wavelength of 600 to 620 of the two spectra (from the average of 650 nm and 560 nm of dyes A and C respectively). The changes in the absorption spectra are attributed to the dimerization or aggregation of dye molecules.
The absorbance of the spectra observed was lower than the target absorbance of 0.8. This observation could be attributed to errors in the dilution of the solutions or inaccuracies in the calibration of the spectrophotometer. It was also possible that the dyes contained impurities that interfered with the absorbance maxima of the solutions.6
Recommendation
Future studies should be done to rectify the sources of experimental error. Replication of data may be considered to improve precision. The disparity between experimental and theoretical values necessitates the testing of other models of elucidating the atomic spectra of conjugated dyes.
Conclusion
UV-Vis is a dependable technique in determining the concentrations and molecular characteristics of conjugated dyes. The particle-in-a-box model was reliable in determining the size of dye molecules. However, there were disparities between theoretical and experimental λmax values.
References
Photochem. Photobiol. Herzog, B.; Schultheiss, A.; Giesinger, J. On the Validity of Beer-Lambert Law and its Significance for Sunscreens. Photochem. Photobiol. 2018, 94, 384-389.
Anal. Chim. Acta. obrecht, A.; Bendoula, R.; Roger, J. M.; Bellon-Maurel, V. Combining Linear Polarization Spectroscopy and the Representative Layer Theory to Measure the Beer–Lambert Law Absorbance of Highly Scattering Materials. Anal. Chim. Acta 2015, 853, 486-494.
Curr. Protoc. Essent. Lab Tech. Morris, R. Spectrophotometry. Curr. Protoc. Essent. Lab Tech. 2015, 1, 2.1.1-2.1.30.
Food Chem. Martelo-Vidal, M.J.; Vázquez, M. Determination of Polyphenolic Compounds of Red Wines by UV–VIS–NIR Spectroscopy and Chemometrics Tools. Food Chem. 2014, 158, 28-34.
J. Chem. Educ. Kuntzleman, T. S.; Jacobson, E. C. Teaching Beer’s Law and Absorption Spectrophotometry with A Smart Phone: A Substantially Simplified Protocol. J. Chem. Educ. 2016, 93, 1249-1252.
Actuators B: Chem. Starecki, F.; Charpentier, F.; Doualan, J. L.; Quetel, L.; Michel, K.; Chahal, R.; Troles, J.; Bureau, B.; Braud, A.; Camy, P.; Moizan, V. Mid-IR Optical Sensor for CO2 Detection Based on Fluorescence Absorbance of Dy3+: Ga5Ge20Sb10S65 Fibers. Sens. Actuators B: Chem. 2015, 207, 518-525.
Spectrochim. Acta A Mol. Biomol. Spectrosc. Mäntele, W.; Deniz, E. UV–VIS Absorption Spectroscopy: Lambert-Beer Reloaded. Spectrochim. Acta A Mol. Biomol. Spectrosc. 2017, 173, 965-968
LWT – Food Sci. Technol. Souto, U. T.; Barbosa, M. F.; Dantas, H. V.; de Pontes, A. S.; da Silva, L. W.; Diniz, P. H.; de Araújo, M. C.; da Silva, E. C. Identification of Adulteration in Ground Roasted Coffees Using UV–Vis Spectroscopy and SPA-LDA. LWT – Food Sci. Technol. 2015, 63, 1037-1041.
Trends Analyt. Chem. Granato, D.; Santos, J. S.; Maciel, L. G.; Nunes, D. S. Chemical Perspective and Criticism on Selected Analytical Methods Used to Estimate the Total Content of Phenolic Compounds in Food Matrices. Trends Analyt. Chem. 2016, 80, 266-279.
Phys. Lett. A. Dong, S.; Sun, G. H.; Dong, S. H.; Draayer, J. P. Quantum Information Entropies for a Squared Tangent Potential Well. Phys. Lett. A. 2014, 378, 124-130.