A statistical model can be used to reflect a particular sample of data. However, the process is not straightforward. It requires some procedures and analysis before arriving at the final true reflection of a given sample of data (Rosner, 2010). When a particular model is chosen for use in statistical analysis, how are the seen values closer to the anticipated ones in the model? In other words, are the observed and expected values too different or similar to each other?
The chi-square goodness of fit test can be appropriately used as a statistical test to the above challenge. The test is often employed when testing the relationship of variables in the form of comparison. Hence, a two-way table may assist in analyzing the observed and expected values in a given data sample (Rosner, 2010). In this case, the observed data is analyzed against the assumed independent model. This statistical test can be expressed as an equation in the following manner:
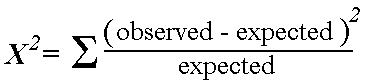
If the calculated statistical test is huge, it will imply that the anticipated and real values are far apart from each other. Therefore, the model will be regarded to be a poor fit.
From a unit population, it is possible to obtain a categorical variable that may be applied when carrying out the chi-square goodness of its test. A hypothesized distribution lacks assurance of validity and accuracy (Rosner, 2010). This type of distribution should be consistent with the sample data at hand. A case in point is illustrated below:
A firm prints baseball cards. From the printed sample of cards, the company finds out that rookies comprise 30 percent of the cards, veterans are taking sixty percent while All-Stars make up the remaining 10 percent. If the printed cards are picked at random, it is possible to apply the test and establish if the claim of the company is correct. If the difference is too large, then the test is considered to be poor.
When to apply the Test
The chi-square goodness of fit test can only yield valid outcomes when certain thresholds are reached. In other words, this statistical test can be best applied under certain conditions (Rosner, 2010). These include:
- A simple random sampling method should be used.
- The variable which is being analyzed should be well known or categorical.
- The frequency of sample observations should not be less than 5. This requirement applies to all levels.
At this point, it is vital to mention that four steps complete the approach. These include stating the hypothesis, building an analysis structure, analyzing the observed statistics, and finally, interpreting the outcomes (Rosner, 2010). Two different types of hypotheses should be stated by an analyst. These include the null and alternative hypotheses. To obtain the best results, both the hypotheses should be mutually exclusive. This implies that if one variable is true, the other one is false. Conversely, a vice versa pattern can be followed. Therefore, the available data should be consistent while the other portion should not be consistent.
In this case, the null hypothesis points out the degree of observation at every instance of the specific data samples being tested (Rosner, 2010). When it comes to the alternative hypothesis, an analyst seeks to make sure that one or more of the given proportions deviates from the norm or is not true.
Reference
Rosner, B. (2010). Fundamentals of Biostatistics (7th Edition). Boston, M.A.: Duxbury Press.